
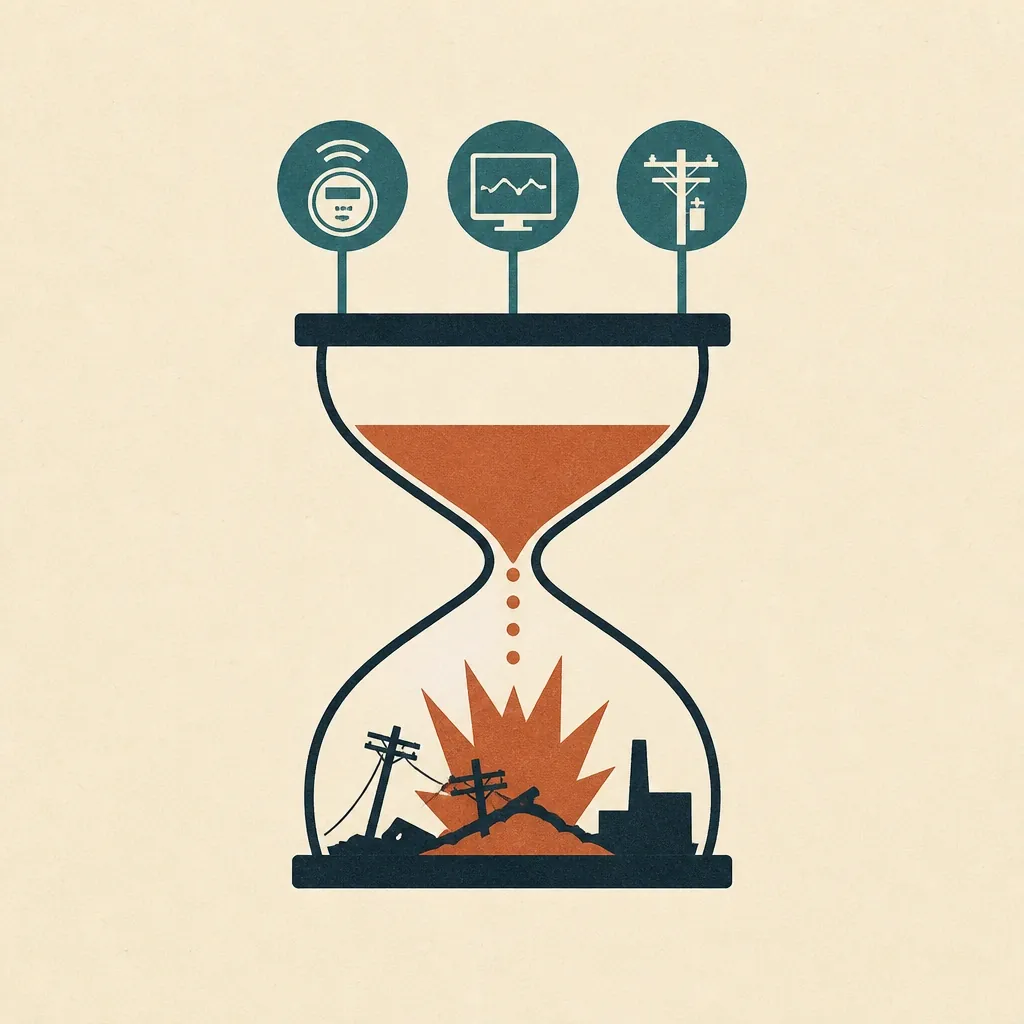
Correlation happens too slowly to prevent anything
Utilities struggle to connect AMI, SCADA and field events fast enough to avoid losses, outages or compliance failures.
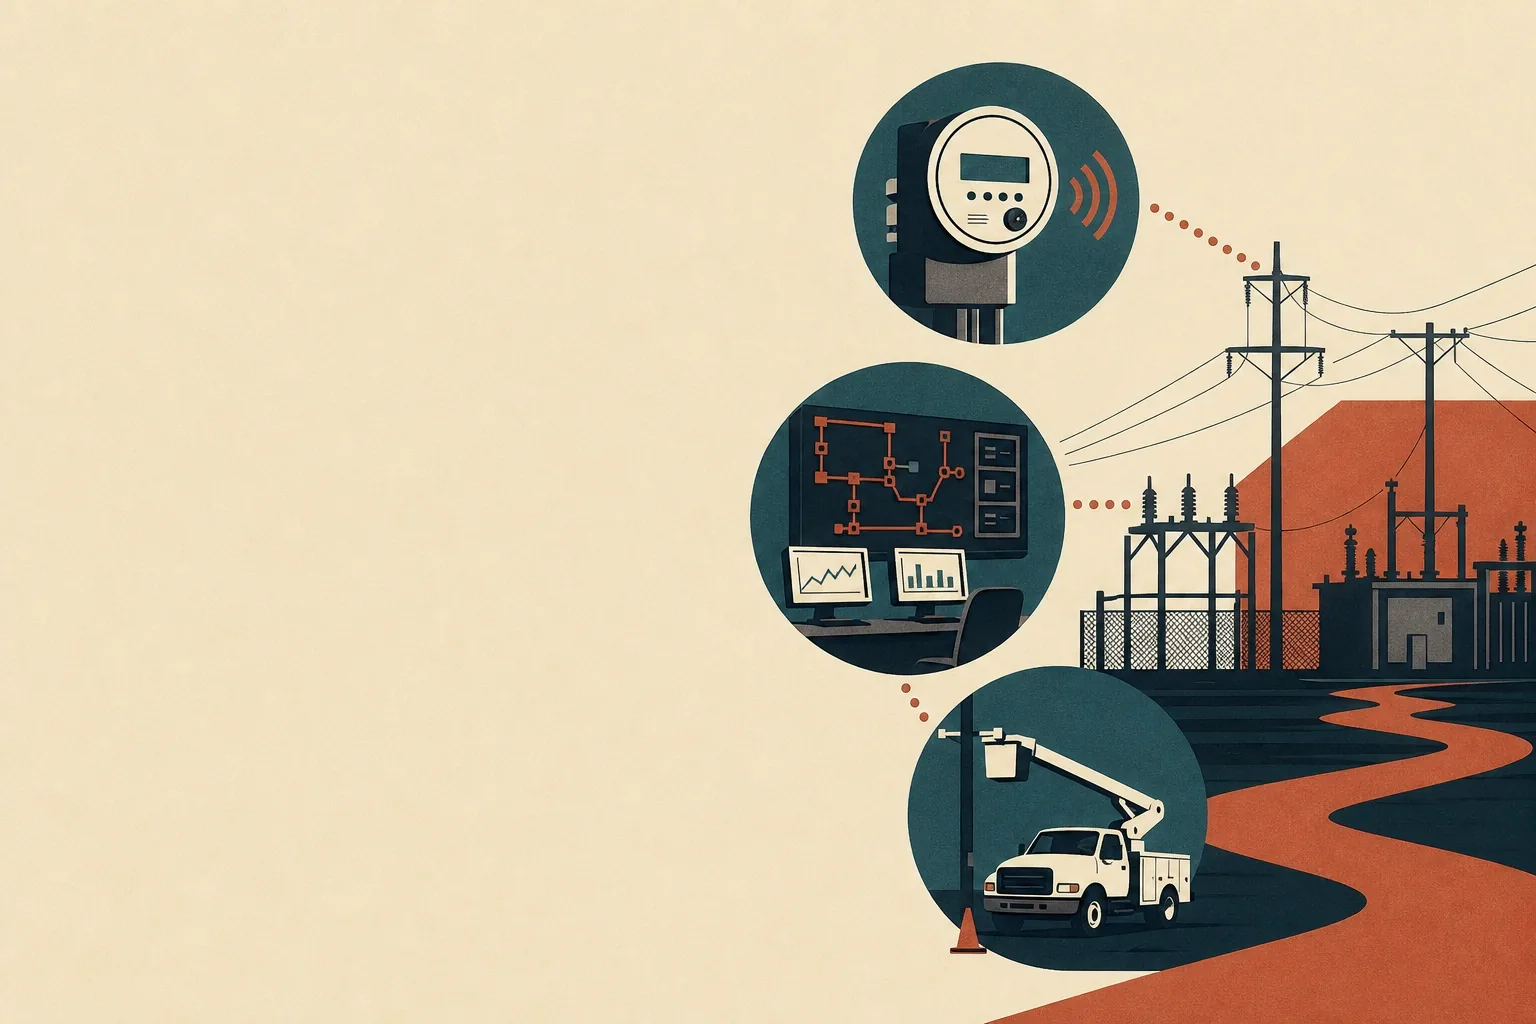
Supply chain & industry · North America
Which is why the operation stays reactive when the data to be proactive already exists.
average power interruption from major events per customer in 2024, against about four hours a year in the decade before.
In North America
Platforms in this market
Rules that apply here
We read the rule before the call. It is the cheapest way to prove we did the work.
What is happening
Utilities struggle to connect AMI, SCADA and field events fast enough to avoid losses, outages or compliance failures.
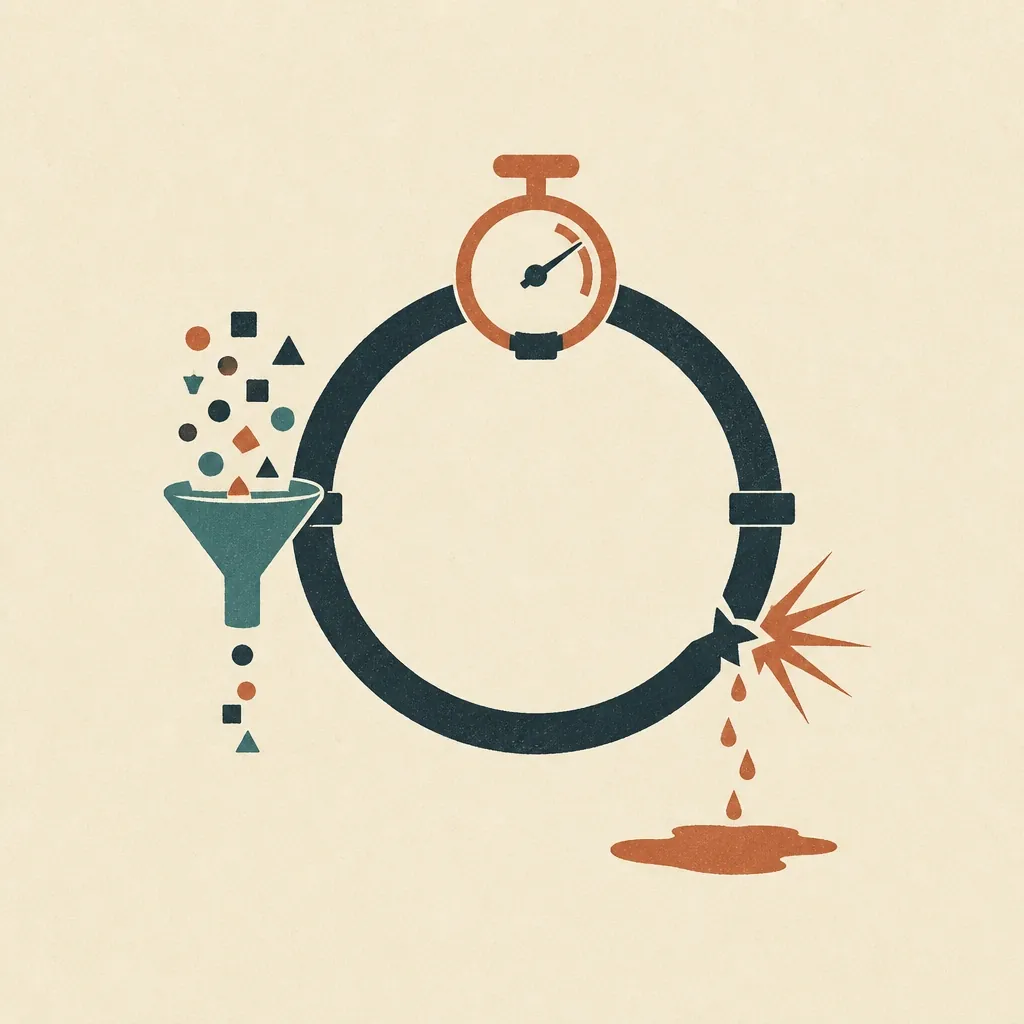
Proactive maintenance, predictive load management and demand forecasting are all possible with data you already collect. Very little of it gets used.
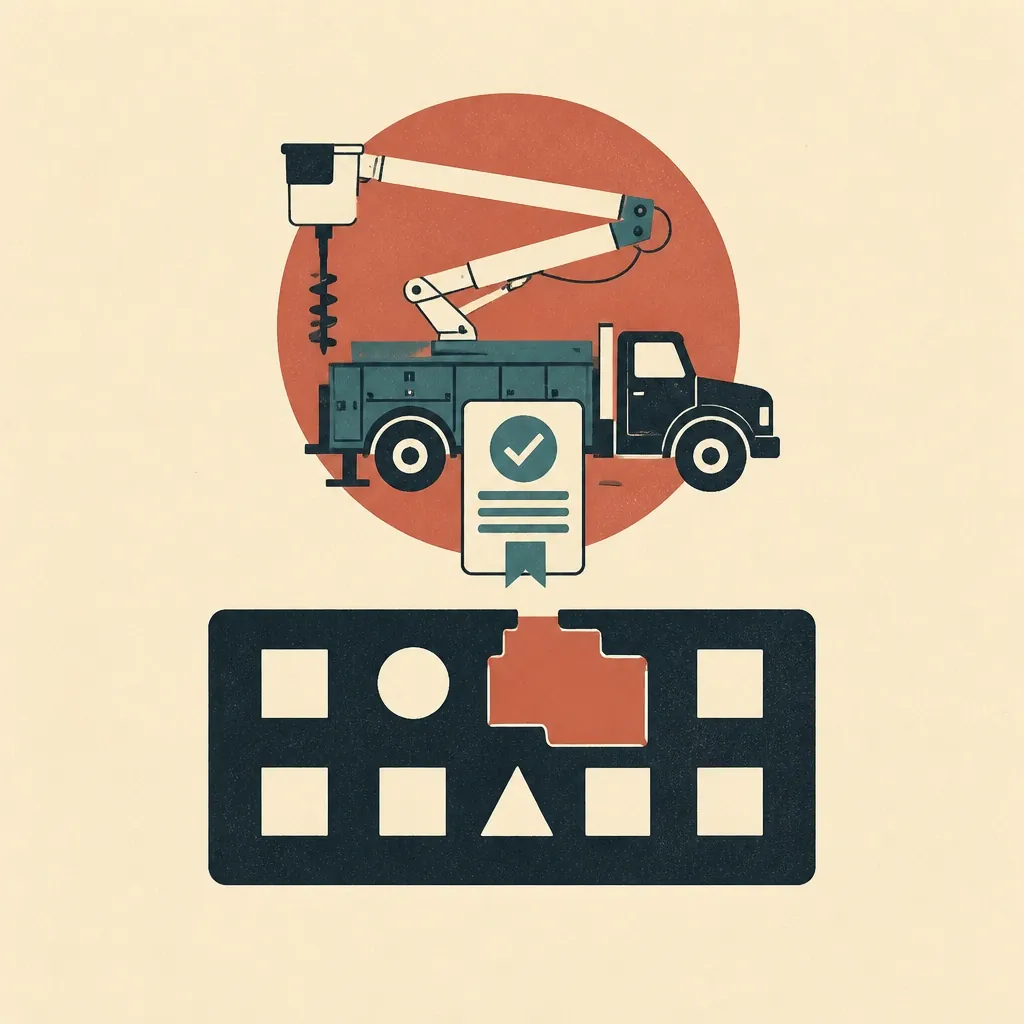
Bucket trucks, digger derricks and line equipment carry certifications alongside normal maintenance. Spreadsheets do not scale to that, and generic fleet systems do not model it.
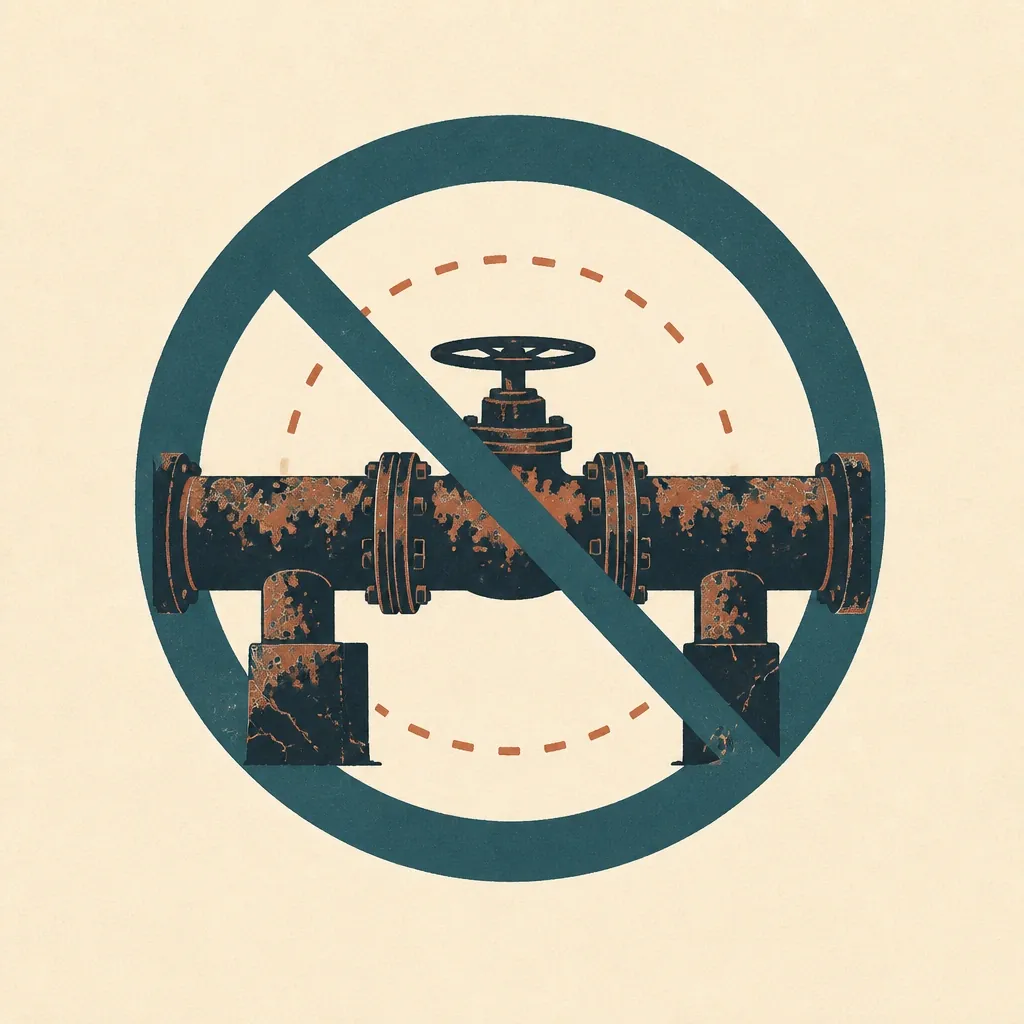
Older assets raise both outage likelihood and operating cost, and lack the instrumentation for anomaly detection.
However hard, whatever it is
This page is about joining field notes to events. If yours is billing, connections or a crew scheduling problem, that is the same job.
 01
01 Days where the work happens, not a workshop in a meeting room. We watch the job get done and write down the shortcuts nobody wrote down.
 02
02 Your data, your rules, your vendors and their documentation, and the published research on your sector. We report what is actually in there.
 03
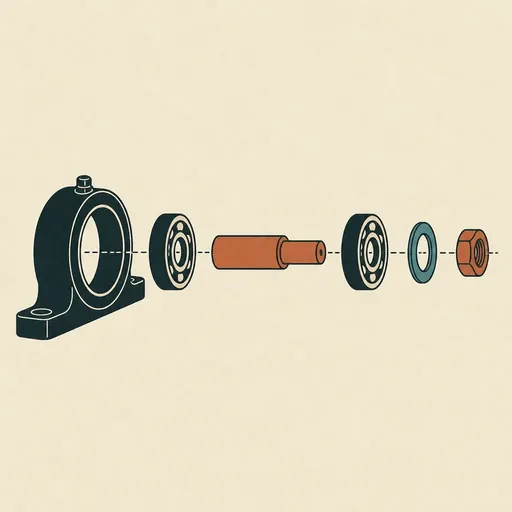
03 Not which tool fixes this. What is actually causing it, taken apart until we reach the piece that cannot be divided further.
 04
04 Weeks, not quarters. By this point we are not guessing what to build, and guessing is the thing that makes projects long.
Where we sit
What you get
Built new for you — none of this exists in your stack today
What you already run — unchanged, and still yours
If a device reports it, we can read it. If it does not, we build the device. Modbus, DNP3, a historian tag, a meter with no port at all. And when nothing measures it, a sensor we make.
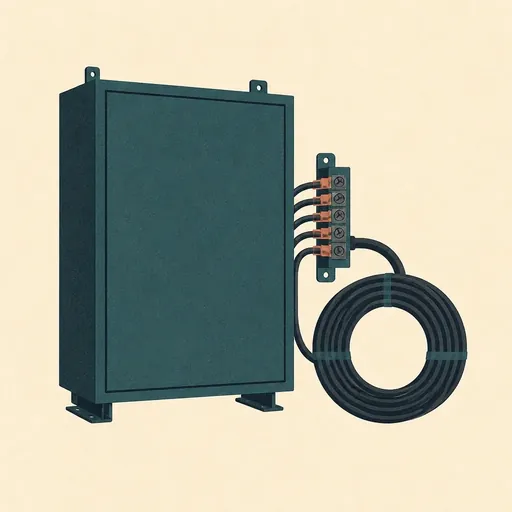 No API
 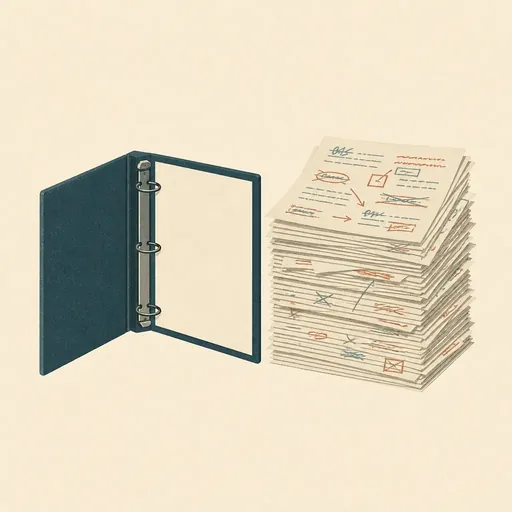 No documentation
 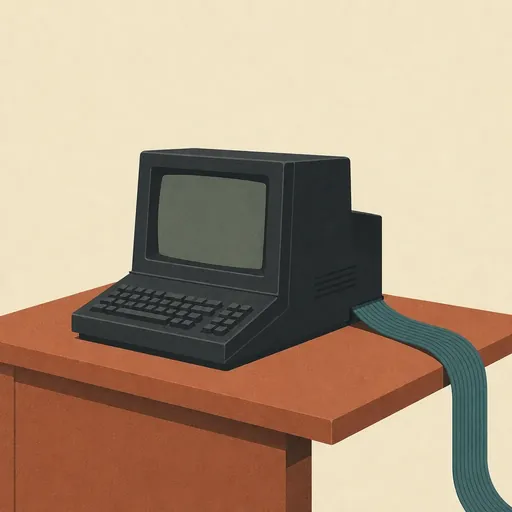 A terminal from 1994
 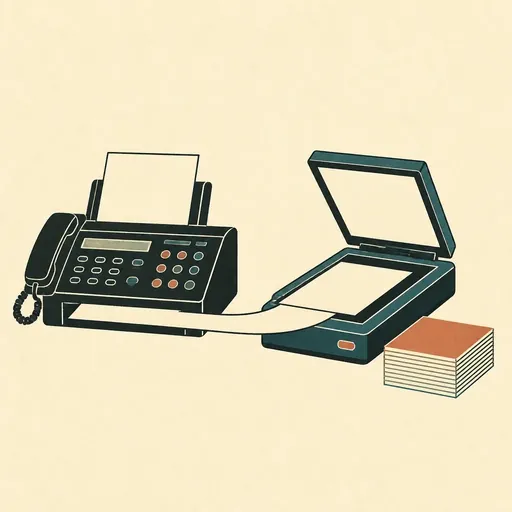 It arrives as paper
  The vendor said no
  It reports nothing
 Not a list of limits. Name yours on the call.
And once we can reach it, a model can read it. Most of the value here is in the sources nobody ever structured — the note, the letter, the screen.
Intelligence, plumbed in
The build is a connector to the work-order system, one agreed fault vocabulary, and a test set of faults you already know.
How we make AI survive real data Connectors
  A semantic layer
  Evals you can check
 What changes
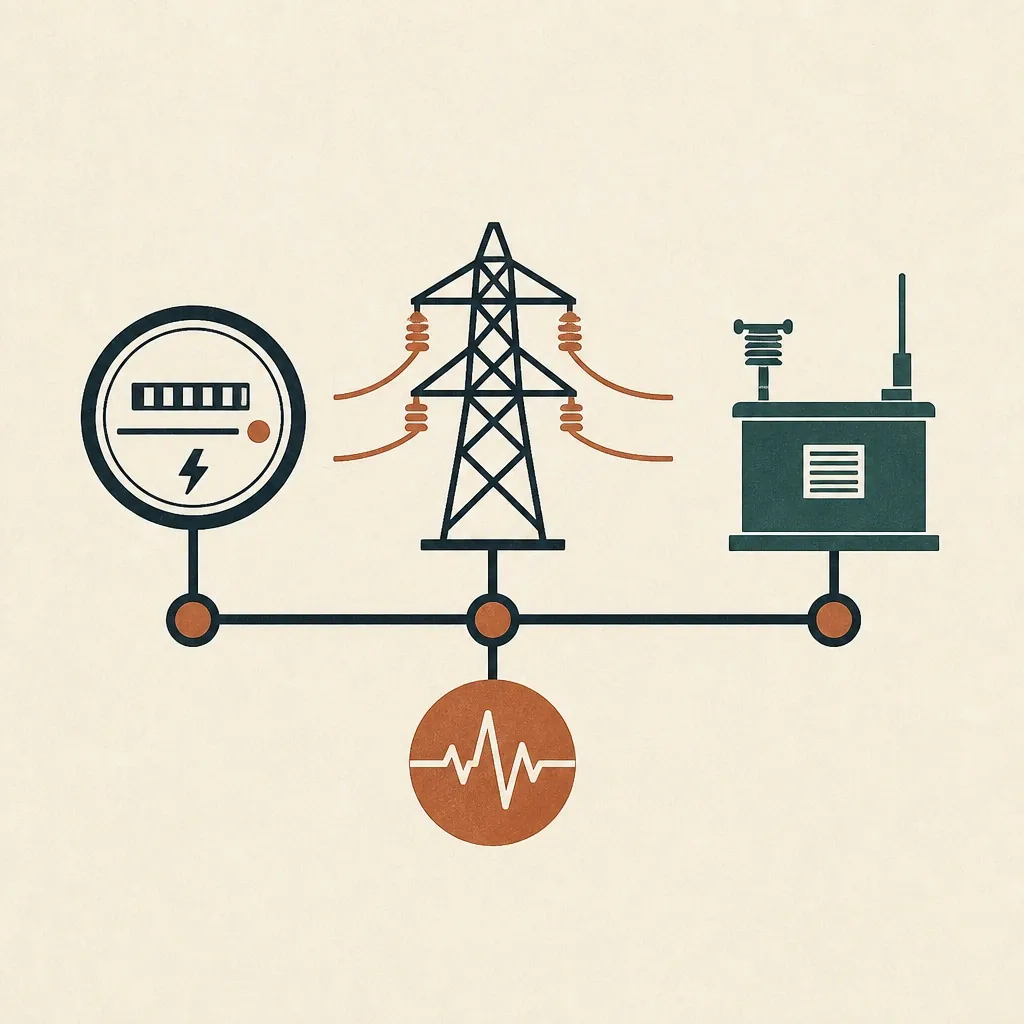 Correlated
 So an anomaly becomes an event with context rather than three unrelated alarms.
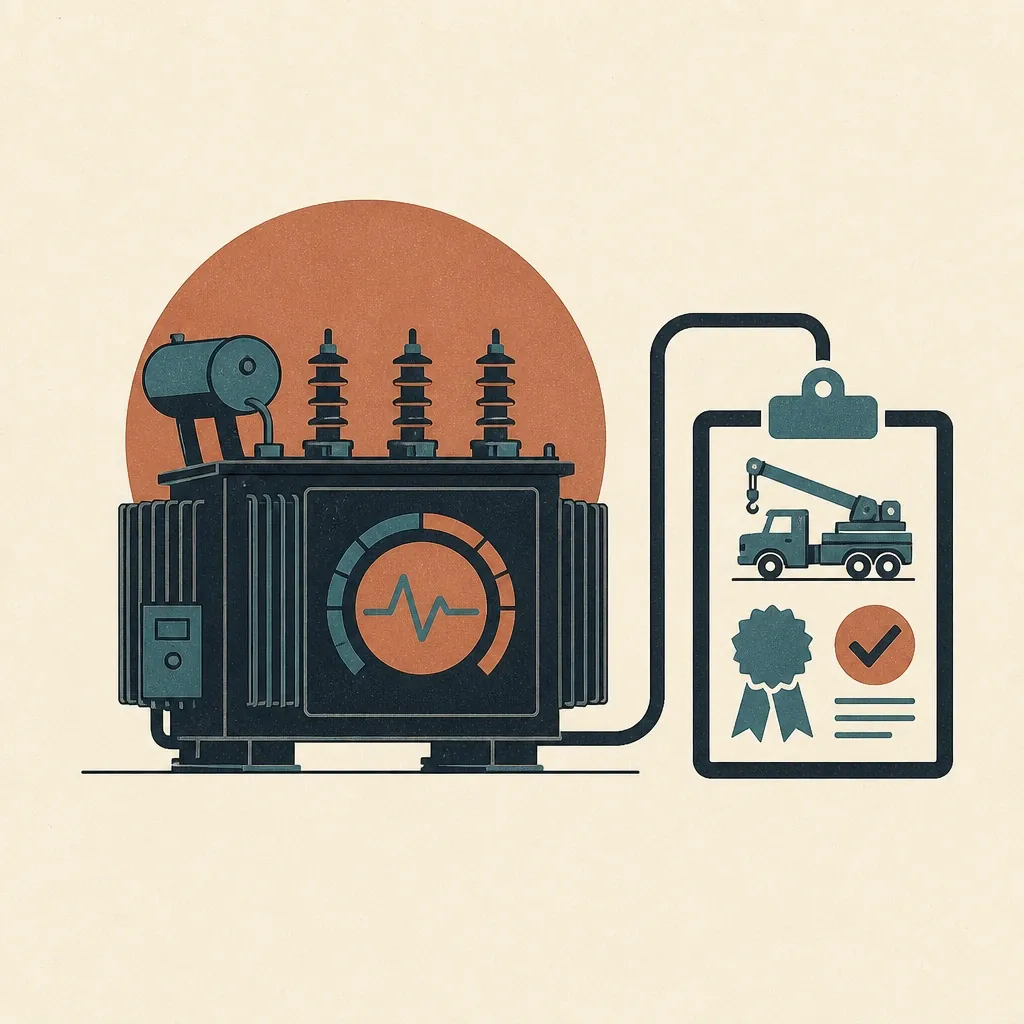 Condition-based
 Including certification status for specialised equipment, tracked alongside mechanical condition.
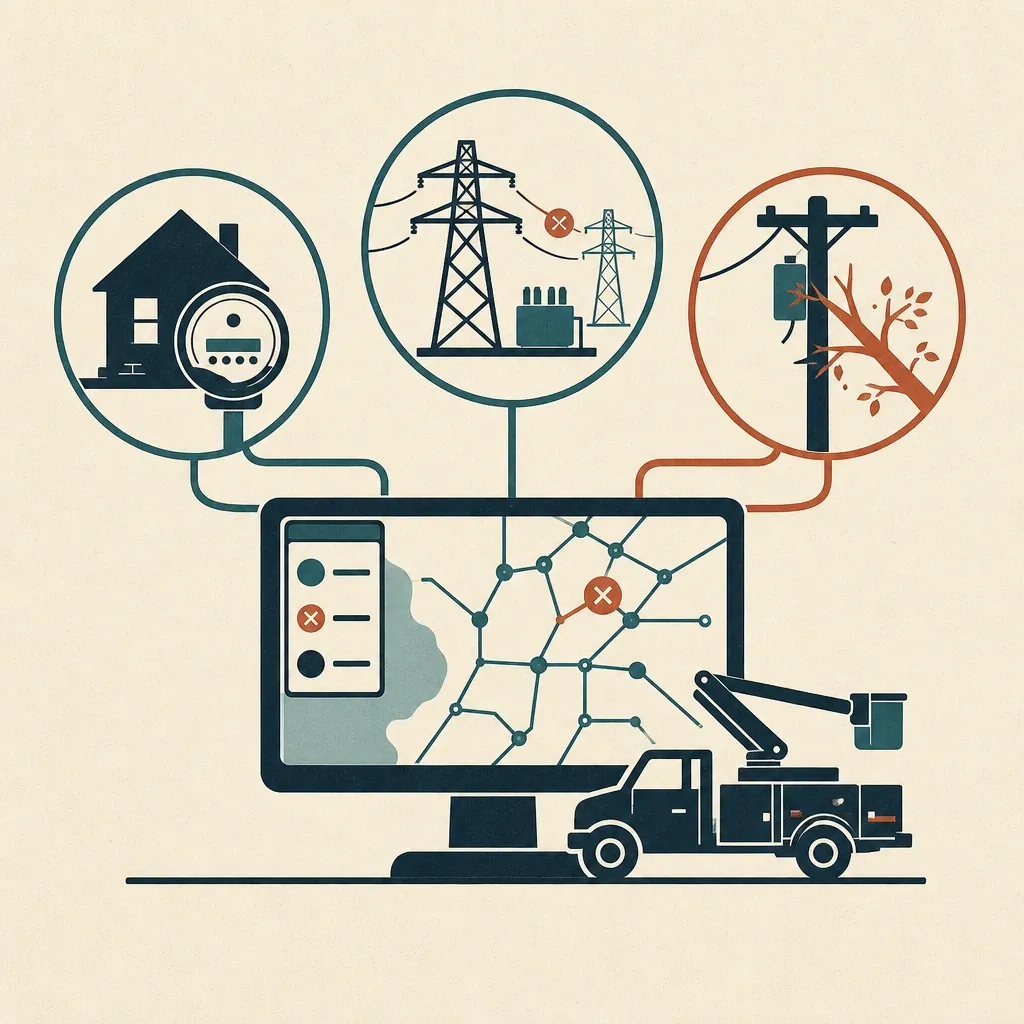 Faster restore
 What the meters saw, what the grid saw and what the crew found, in one place while it is still happening.
Who this is for
 Director of Operations
  Asset Management Head
  Field Services Manager
  Grid Operations Manager
  Compliance Lead
 Straight answers
Agreed, and we design for that. We read through a data diode or a historian replica. We are never a part the control system depends on. Nothing we build can affect grid operations.
Usually that is the better option. Historians are built to be read from, they carry the history you need, and they keep us entirely out of the control path.
Yes. We build the sensors and the firmware, as well as the software above them. That matters when the answer is to start measuring something that reports nothing today.
The gain is usually in the field notes, not the telemetry. We read those, join them to the events, and test against faults you already know.
For energy & utilities that means NERC CIP, FERC orders, state PUC reporting and IEEE 1547. We read the rule before the call, so the first meeting is about your operation rather than about us catching up.
What you already run stays where it is. Around it we build software, hardware and the process itself. Here that means a sensor we build when the meter cannot tell you enough.
See everything we build Software
  Hardware
  Ways of working
  Whole ventures
 Honest about the numbers
We have not localised it, because a number nobody can check is worth less than a real one plus this sentence. The pattern travels. The size of it in your market is a question for the call.
Same industry, other markets