

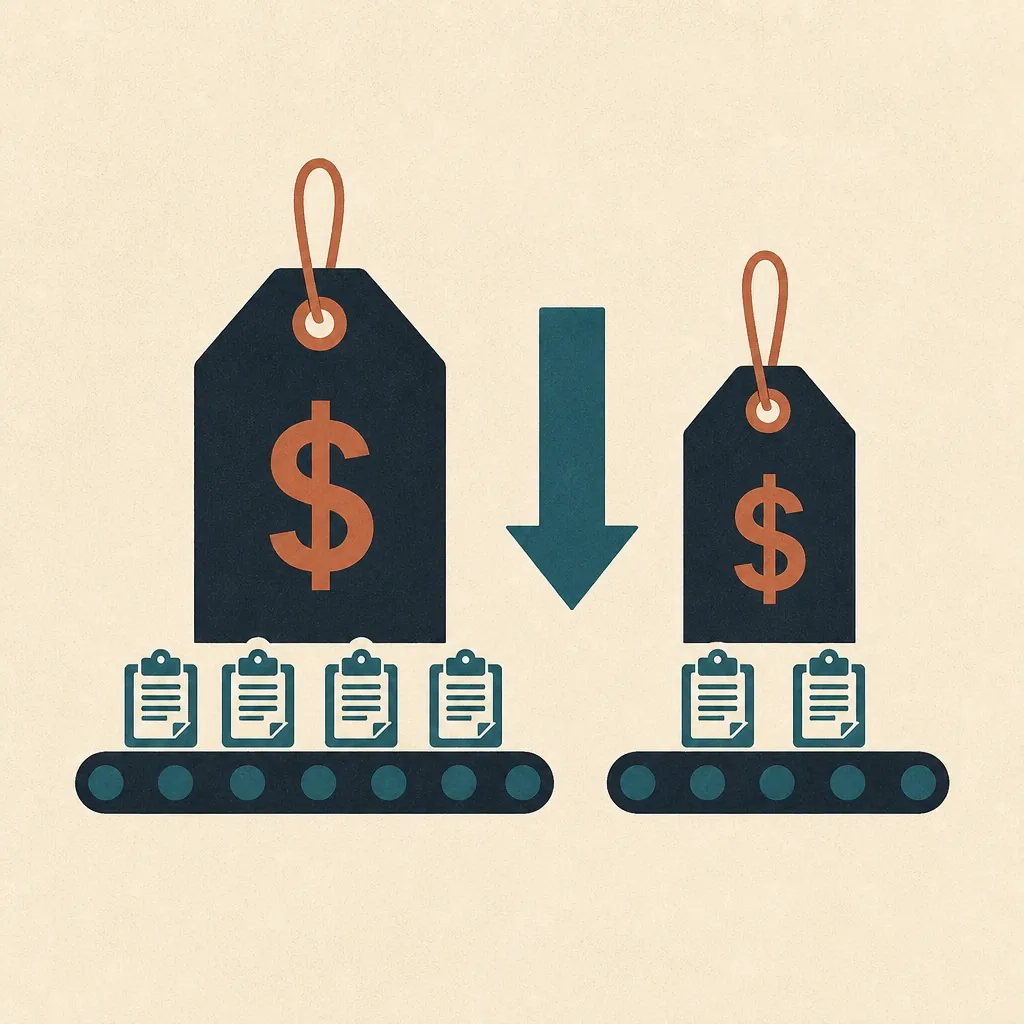
30-40% Cost per claim reduction is available
Carriers that have automated the claim workflow operate at $25 to $36 per claim against an industry norm of $40 to $60.

Financial services
Tracing a discrepancy back through policy admin, bordereaux and carrier statements has no automated equivalent at any accessible price.
property and casualty combined ratio, meaning the industry paid out more than it took in on underwriting.
What is happening
Carriers that have automated the claim workflow operate at $25 to $36 per claim against an industry norm of $40 to $60.

Commission due versus commission paid. Premium written versus premium collected. Bordereaux against carrier statements. Reinsurance settlement. All manual, all monthly.
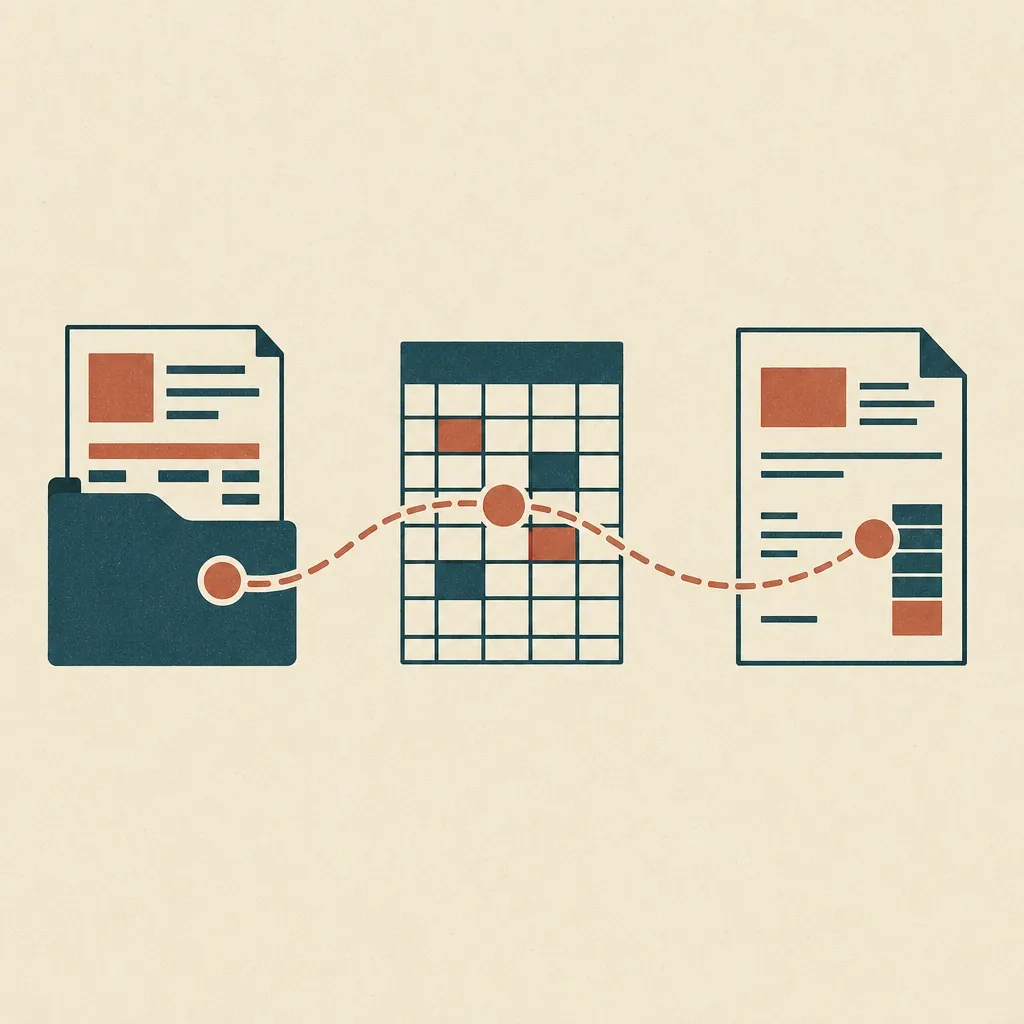
Policy admin, the bordereau spreadsheet and the carrier statement, with no shared identifier between them.

Cycle time by stage, first-pass processing rate and straight-through rate are measurable. Most operations measure none of them.
Intelligence, plumbed in
We build the mapping, hold it in a semantic layer rather than in a script, and score it against settled months.
How we make AI survive real data Connectors
  A semantic layer
  Evals you can check
 What changes
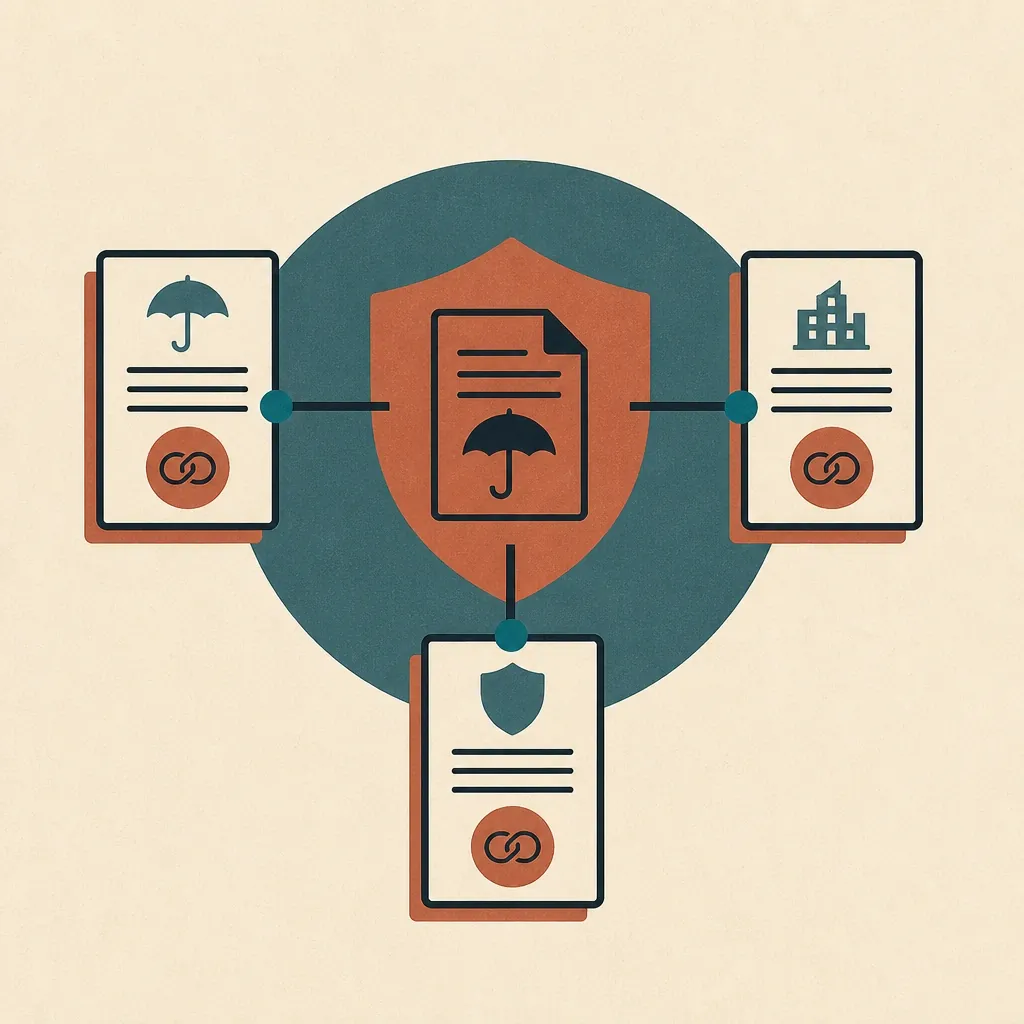 Reconciled
 Across policy admin, bordereaux and carrier statements, with discrepancies traced to the policy rather than to a total.
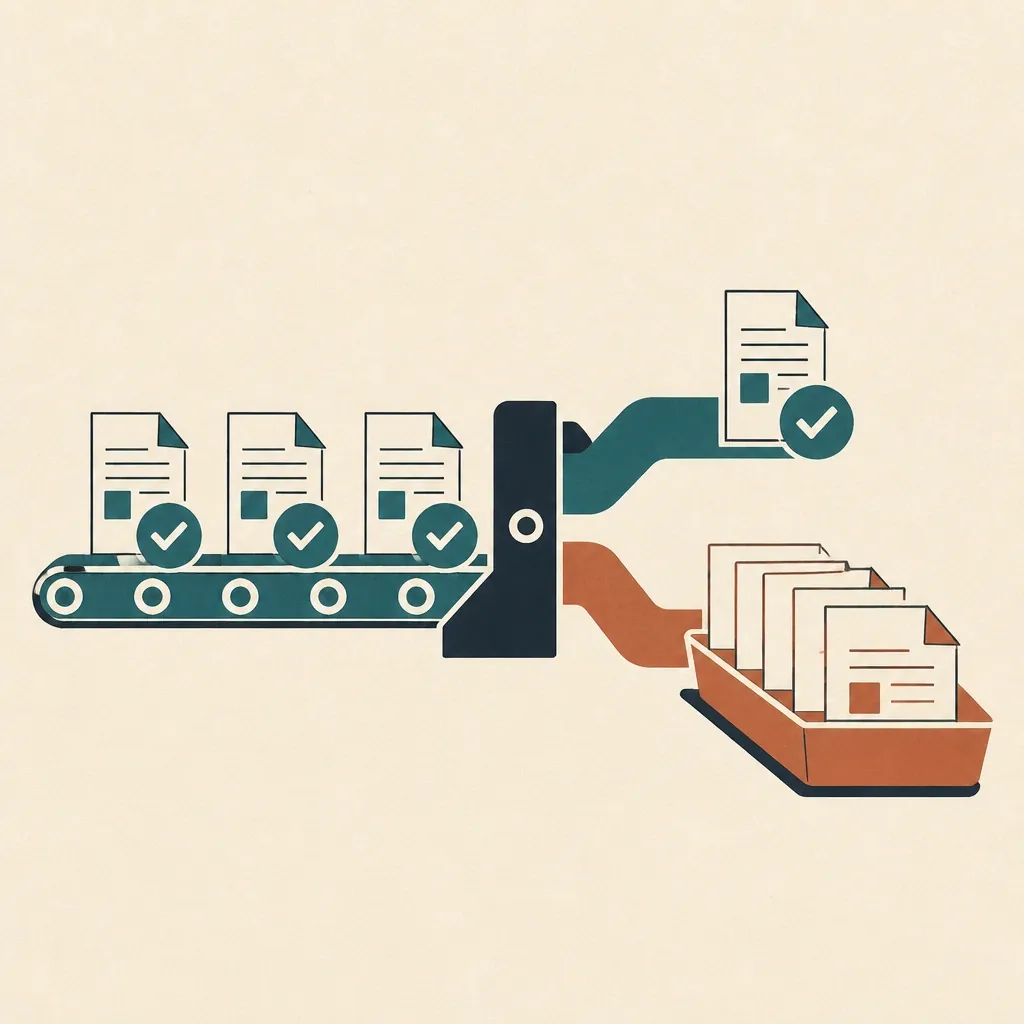 Cycle time
 Straight-through processing where the data supports it, and a ranked queue where it does not.
 Measured
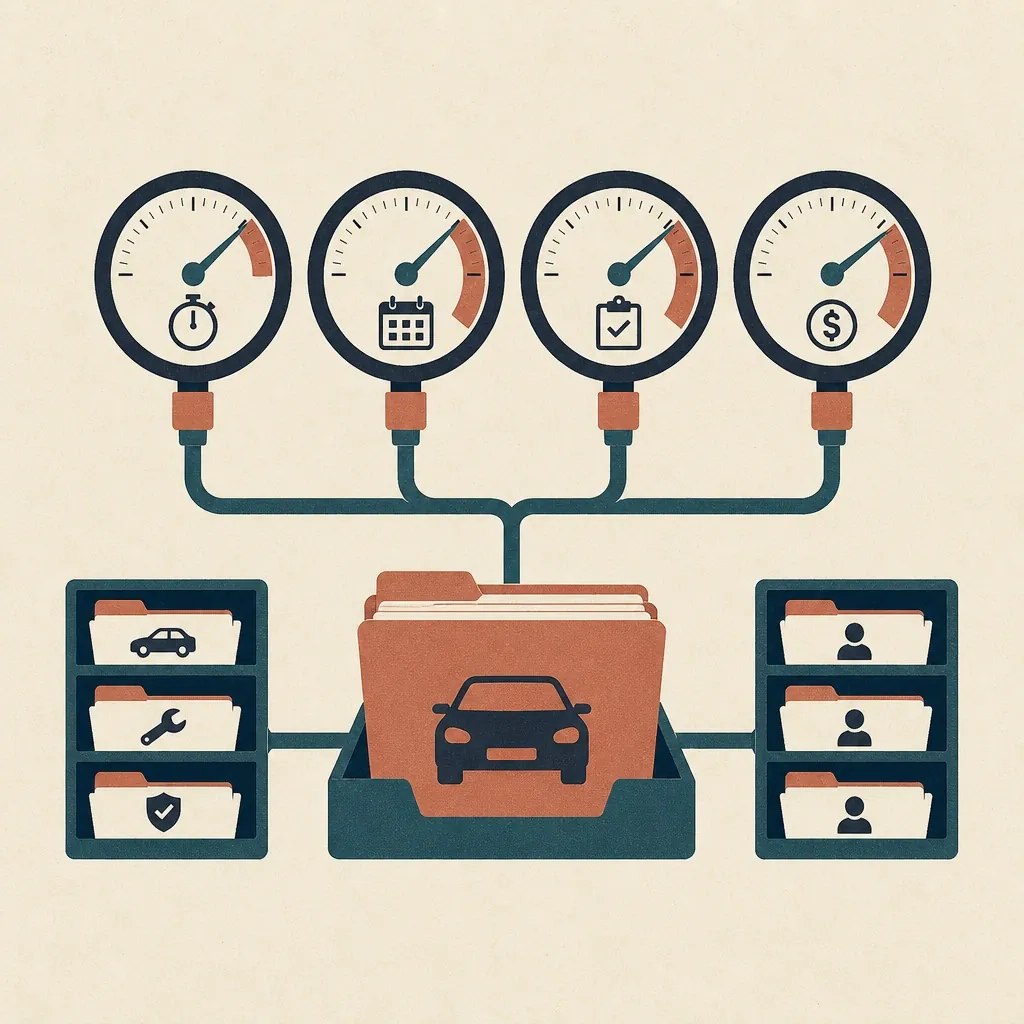
 Handle time, FNOL-to-first-action, first-pass rate and cost per claim, by stage and by handler.
Research
Each one carries its own figures and the citations behind them. Start with whichever sounds most like your week.
However hard, whatever it is
We wrote this about settlement matching. If yours is claims triage, broker onboarding or a solvency return, the method is the same.
 01
01 Days where the work happens, not a workshop in a meeting room. We watch the job get done and write down the shortcuts nobody wrote down.
 02
02 Your data, your rules, your vendors and their documentation, and the published research on your sector. We report what is actually in there.
 03
03 Not which tool fixes this. What is actually causing it, taken apart until we reach the piece that cannot be divided further.
 04
04 Weeks, not quarters. By this point we are not guessing what to build, and guessing is the thing that makes projects long.
Where we sit
What you get
Built new for you — none of this exists in your stack today
What you already run — unchanged, and still yours
However the broker sends it, we can read it. A bordereau with the columns moved, a PDF statement, a legacy policy screen. All of it can be matched.
 No API
  No documentation
  A terminal from 1994
  It arrives as paper
  The vendor said no
  It reports nothing
 Not a list of limits. Name yours on the call.
And once we can reach it, a model can read it. Most of the value here is in the sources nobody ever structured — the note, the letter, the screen.
Who this is for
 Chief Operating Officer
  Head of Claims
  Finance Director
  Head of Underwriting Operations
  Compliance Manager
 Straight answers

It is the normal case, and it is the actual work. A system that only handles a clean standard format solves the easy ten percent. Handling the twelve real formats, including the one that changes every quarter, is what makes it useful.

Yes. We build alongside the policy and claims platform rather than replacing it, integrating through their APIs and data exports.

A free call first. Then we look at your real reconciliation breaks and claim times. If the numbers justify a build, we quote a fixed price before starting.

Yes. The mapping lives in a semantic layer, not in a script, and it is scored against months you have already settled.
Next step
20 minutes. Free.
You tell us what is not working. We ask how the work really gets done.
A few weeks.
We read your systems, including the notes and letters no field holds. You get what is really in there, what it costs, and the accuracy we can hit.
A few months.
Only if step 2 says it is worth it. Fixed price, agreed before we start.