

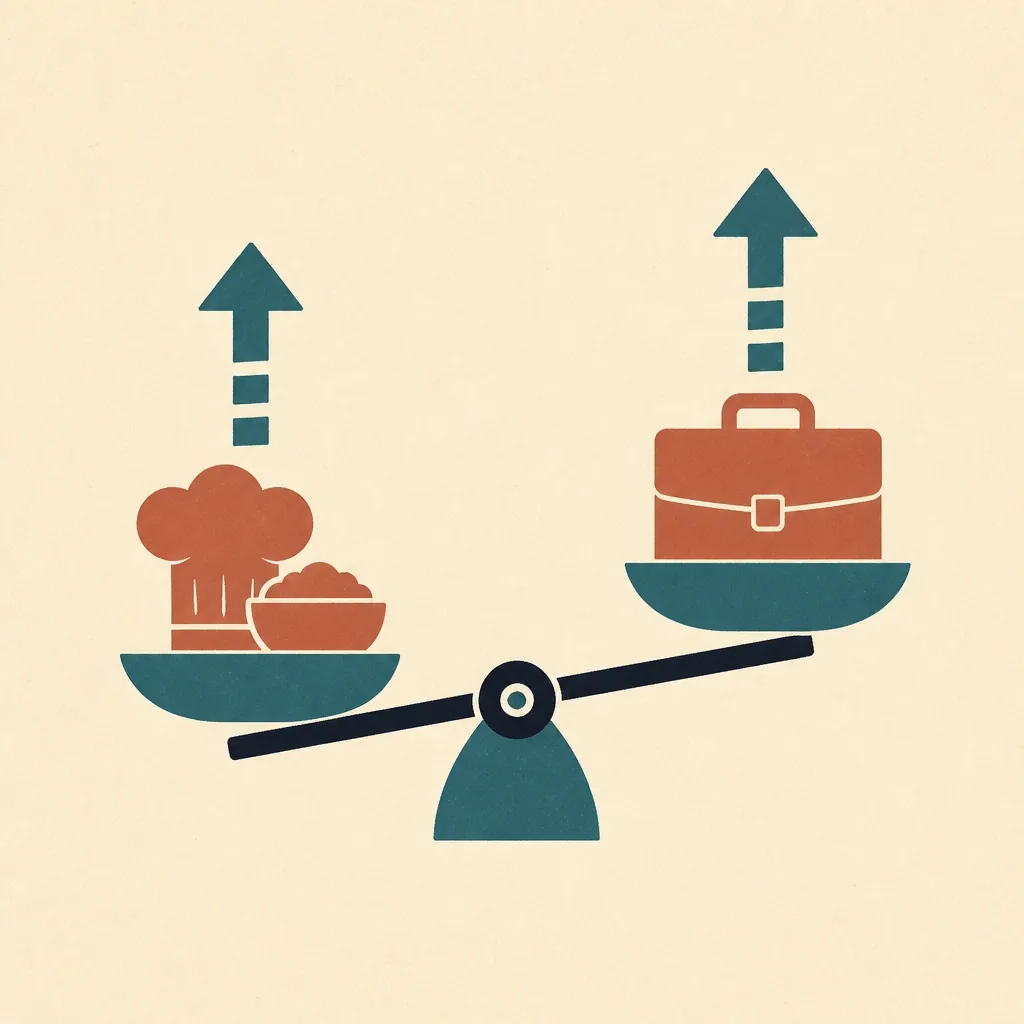
87-88% Expect both labour and food costs to rise
With payroll already consuming 30% to 40% of revenue before food cost enters the calculation.

Commerce & consumer
And eighty-eight percent of operators expect food costs to rise again this year.
job-openings rate in accommodation and food services, among the highest of any sector.
What is happening
With payroll already consuming 30% to 40% of revenue before food cost enters the calculation.

Around 11.4 million tons a year. Most of it invisible at the individual site level, because nobody measures it per shift.
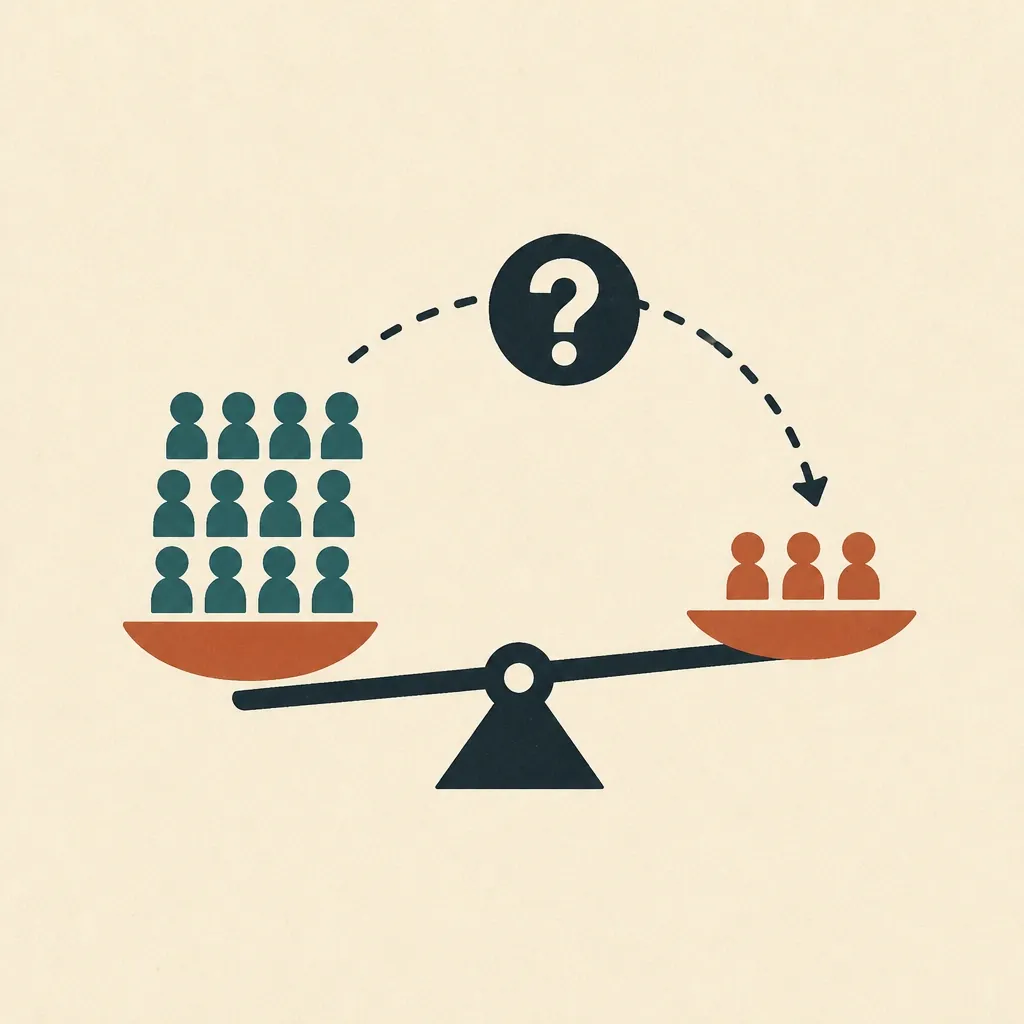
Rosters are built on last week's pattern rather than on forecast covers, so you are simultaneously over-staffed and short.

By which point the site that slipped has slipped for three weeks.
Intelligence, plumbed in
One line-level meaning for every supplier's format, a connector into your ledger, and a month of checking against the paper.
How we make AI survive real data Connectors
  A semantic layer
  Evals you can check
 What changes
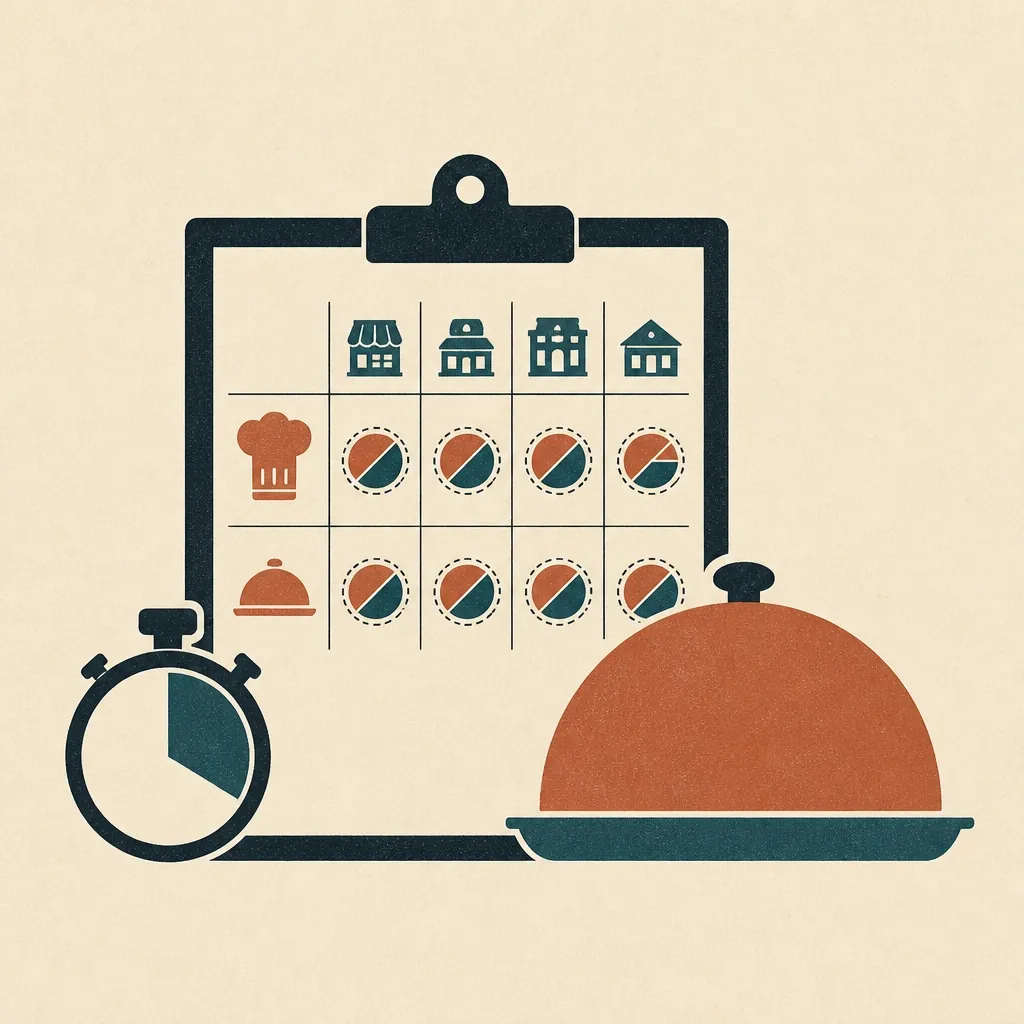 Per shift
 Against forecast covers, so a bad week is visible on day two rather than at month end.
 Waste
Waste By item, prep stage and shift — which is the only level at which anyone can actually change it.
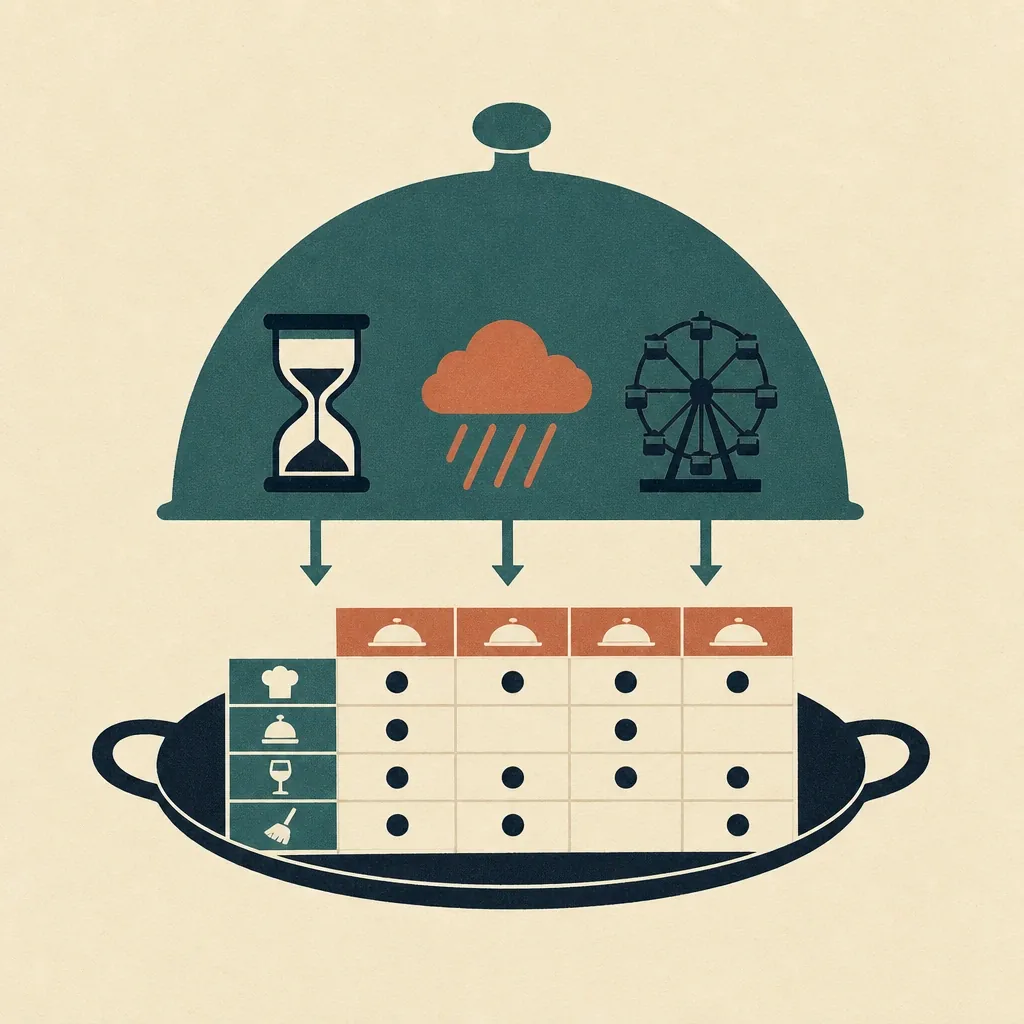 Rosters
 Using your own covers history, weather and local events rather than last week repeated.
Research
Each one carries its own figures and the citations behind them. Start with whichever sounds most like your week.
However hard, whatever it is
We wrote this about the roster following the covers. If yours is waste, stock or a delivery platform eating the margin, that is the same work.
 01
01 Days where the work happens, not a workshop in a meeting room. We watch the job get done and write down the shortcuts nobody wrote down.
 02
02 Your data, your rules, your vendors and their documentation, and the published research on your sector. We report what is actually in there.
 03
03 Not which tool fixes this. What is actually causing it, taken apart until we reach the piece that cannot be divided further.
 04
04 Weeks, not quarters. By this point we are not guessing what to build, and guessing is the thing that makes projects long.
Where we sit
What you get
Built new for you — none of this exists in your stack today
What you already run — unchanged, and still yours
If the till rang it, we can read it. A POS with no export, a rota on paper, a supplier invoice as a PDF. All of it can be joined.
 No API
  No documentation
  A terminal from 1994
  It arrives as paper
  The vendor said no
  It reports nothing
 Not a list of limits. Name yours on the call.
And once we can reach it, a model can read it. Most of the value here is in the sources nobody ever structured — the note, the letter, the screen.
Who this is for
 Operations Director
  Multi-site Manager
  Head Chef / Culinary Director
  Finance Manager
  Owner
Owner Straight answers

POS reporting tells you what sold. It does not connect that to labour scheduled, stock consumed and waste produced for the same shift, and the margin question lives in that combination.

Usually three or more, where comparison across sites starts producing insight. Below that, the payback tends to come from waste and scheduling rather than analytics.

As little as possible. If recording waste takes more than a few seconds, it will not get done. So it has to be almost instant, or worked out from data you already produce.

Read every supplier invoice however it is laid out, and line it up with the till. We check a month of paper before you rely on it.
Next step
20 minutes. Free.
You tell us what is not working. We ask how the work really gets done.
A few weeks.
We read your systems, including the notes and letters no field holds. You get what is really in there, what it costs, and the accuracy we can hit.
A few months.
Only if step 2 says it is worth it. Fixed price, agreed before we start.