

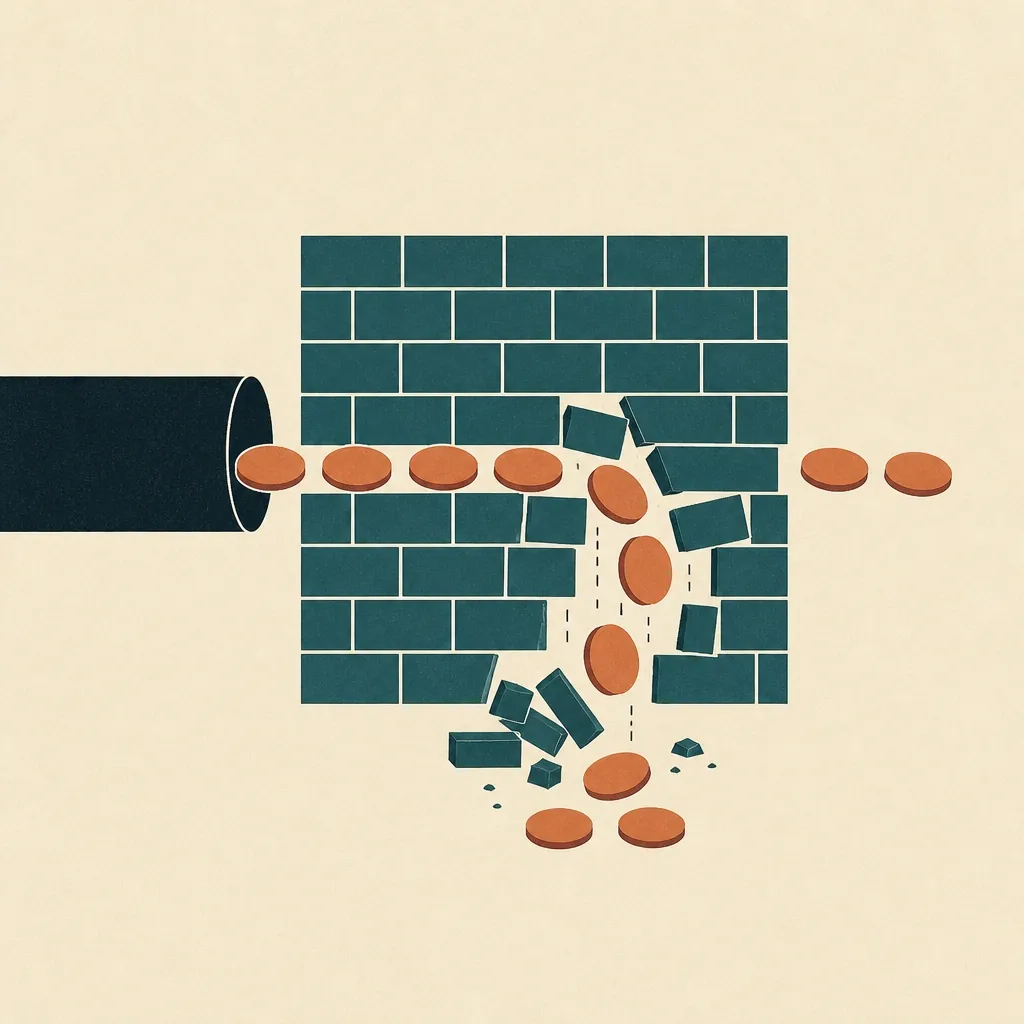
~4% Of expected revenue never arrives
A 2.7% final denial rate on top of 1.3% bad debt. Both are recoverable in part, and both are treated as the cost of doing business.

Healthcare
Denials are not a billing problem. They are a documentation problem that surfaces as a billing problem.
of hospital revenue lost to denials and uncollected bills in one year, up 25 percent.
Source: Kodiak Solutions, State of the healthcare revenue cycle
What is happening
A 2.7% final denial rate on top of 1.3% bad debt. Both are recoverable in part, and both are treated as the cost of doing business.

US hospitals spend roughly $19.7 billion a year overturning denials. The cost is almost entirely staff time.

Average denied inpatient claim value rose 12% and outpatient 14% in one year, alongside rising audit volume.

Medical necessity lives in physician narrative and nursing documentation. Your claims system holds structured fields. Bridging the two is manual, every single time.
Intelligence, plumbed in
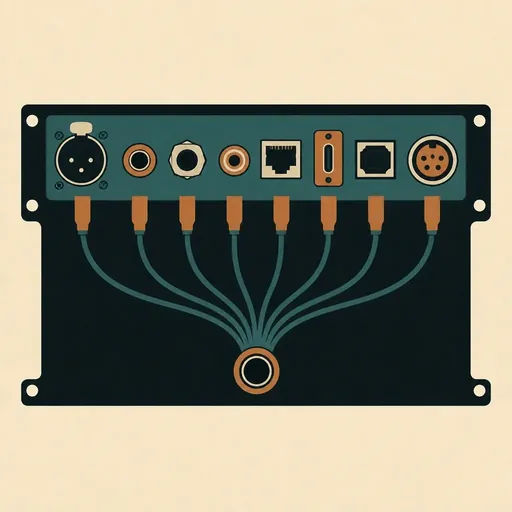
The work is HL7 and FHIR plumbing, one agreed meaning per field, and an eval set of appeals your team already won.
How we make AI survive real data Connectors
  A semantic layer
 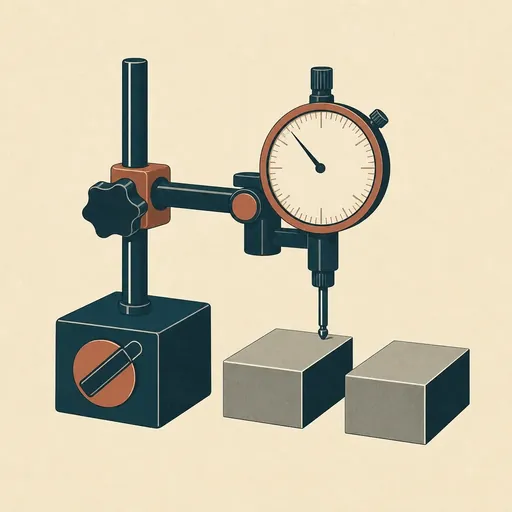 Evals you can check
 What changes
 Denials
 The clinical evidence pulled from the record, matched to the payer's stated reason, formatted to that payer's requirements.
 Prevention
 Patterns from your own denial history, applied to claims that have not gone out yet. The cheapest denial is the one that never happens.
 Visibility
 So the conversation with a payer is evidence-led, and so you know which fights are worth having.
Research
Each one carries its own figures and the citations behind them. Start with whichever sounds most like your week.
However hard, whatever it is
This page happens to be about appeals. If your problem is theatre scheduling, bed flow or a report nobody trusts, we start in exactly the same place.
 01
01 Days where the work happens, not a workshop in a meeting room. We watch the job get done and write down the shortcuts nobody wrote down.
 02
02 Your data, your rules, your vendors and their documentation, and the published research on your sector. We report what is actually in there.
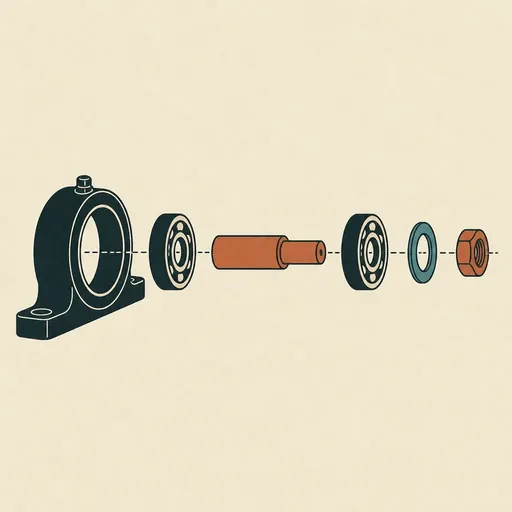 03
03 Not which tool fixes this. What is actually causing it, taken apart until we reach the piece that cannot be divided further.
 04
04 Weeks, not quarters. By this point we are not guessing what to build, and guessing is the thing that makes projects long.
Where we sit
What you get
Built new for you — none of this exists in your stack today
What you already run — unchanged, and still yours
If it is in the chart, we can reach it. HL7 v2, FHIR, an interface engine, a scanned consent form. We have built against all four.
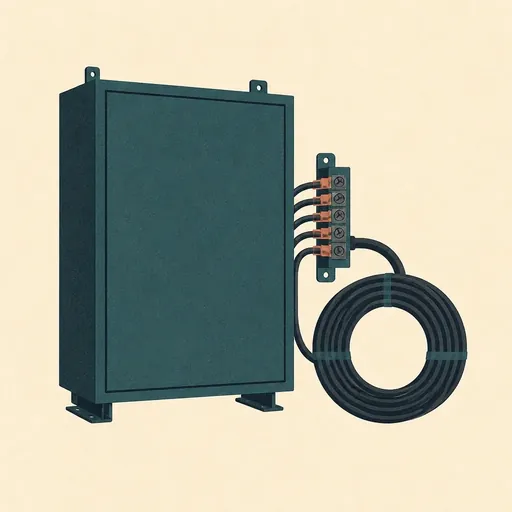 No API
  No documentation
  A terminal from 1994
  It arrives as paper
  The vendor said no
  It reports nothing
 Not a list of limits. Name yours on the call.
And once we can reach it, a model can read it. Most of the value here is in the sources nobody ever structured — the note, the letter, the screen.
Who this is for
 VP Revenue Cycle
  Director of Patient Financial Services
  CFO
CFO  Chief Medical Information Officer
  Director of HIM
 Straight answers
Underneath them, usually. Billing platforms and RCM vendors are built to submit claims and follow up on status. The work that does not get done is arguing a denial, because that means reading the medical record rather than querying a database. That is the gap we build into.

No, and you should be suspicious of anyone who suggests it. We build the operational layer on top of the system of record you already have.

A free call, then a proper look at your data. We come back with your real denial and appeal numbers, what you can recover, and whether a build is worth it. If it is not, we say so.

It assembles the evidence and drafts a first version. A person signs every one. We score the drafts against appeals your team already won.
Also in healthcare
Your team is not wrong about the denials. They just do not have four hours per appeal to prove it.
HealthcareNinety-two percent of practices have hired or reassigned staff purely to keep up with it.
HealthcareCaregiver turnover is at 79%. The software you bought was designed around the chart, not the caregiver.
Next step
20 minutes. Free.
You tell us what is not working. We ask how the work really gets done.
A few weeks.
We read your systems, including the notes and letters no field holds. You get what is really in there, what it costs, and the accuracy we can hit.
A few months.
Only if step 2 says it is worth it. Fixed price, agreed before we start.