


Denials rose 25 percent in a year, and most of it was clinical
Why are our claim denials rising even though our billing has not changed?
Figures and rules on this page apply to
United States
Working somewhere else? The shape of the problem usually travels. The deadlines do not.
What this looks like
The billing team is doing the same work to the same standard. The denial queue is longer anyway, and the reasons have shifted: fewer coding errors, more medical necessity and missing prior authorisation. Those are clinical arguments, and the people who can win them are on a ward, not in the billing office.

The numbers
Every figure here is someone else’s. Check them.
- $48.4Bnet revenue leakage across hospitals in the dataset, up from $38.6 billion the year before
- 2,300hospitals and 350,000 physicians in the dataset behind these figures
Why it happens
It is not a people problem.
The denial has moved upstream. A coding denial is an argument about a field, and a billing platform is good at fields. A medical necessity denial is an argument about a chart, and the evidence for it is prose written by a clinician days earlier. Nothing in the revenue cycle reads prose.
Why your current software has not fixed it
Because it was never built to.
Your billing platform and your clearing house are built to submit claims and track their status, which they do well. Arguing a clinical denial means reading unstructured notes and building a medical necessity case against the payer's stated reason. That is a different kind of work with a different data shape, and no claims product is architected for it. This is a product boundary, not a failing.
Intelligence, plumbed in
The evidence that overturns a clinical denial is prose in the record.
The build is the worklist, the evidence pack assembled from the chart, and a denial split by cause rather than by payer. Underneath it: a connector, one agreed meaning per field, and a test set scored on your own records.
How we make AI survive real data-
 Connectors
 -
 A semantic layer
 -
 Evals you can check
However hard, whatever it is
Denials are one example. Bring the one actually costing you.
We wrote this up because it is measurable. Plenty of what a hospital loses is not measurable yet, and making it measurable is part of the work.
-
 01
01 We sit with you
Days where the work happens, not a workshop in a meeting room. We watch the job get done and write down the shortcuts nobody wrote down.
-
 02
02 We read everything
Your data, your rules, your vendors and their documentation, and the published research on your sector. We report what is actually in there.
-
 03
03 We break it to first principles
Not which tool fixes this. What is actually causing it, taken apart until we reach the piece that cannot be divided further.
-
 04
04 Then we build
Weeks, not quarters. By this point we are not guessing what to build, and guessing is the thing that makes projects long.
What we build
Specific enough to argue with.
Four mechanisms, not four features. Each one is a thing that happens on its own, every day, whether or not anyone remembers to run it.
-

Every denial pulled into one worklist from the payer portals and the clearing house, aged, owned, and tracked against its appeal deadline.
-

The clinical evidence for each case assembled from the chart automatically, so the person writing the appeal starts from a draft.
-
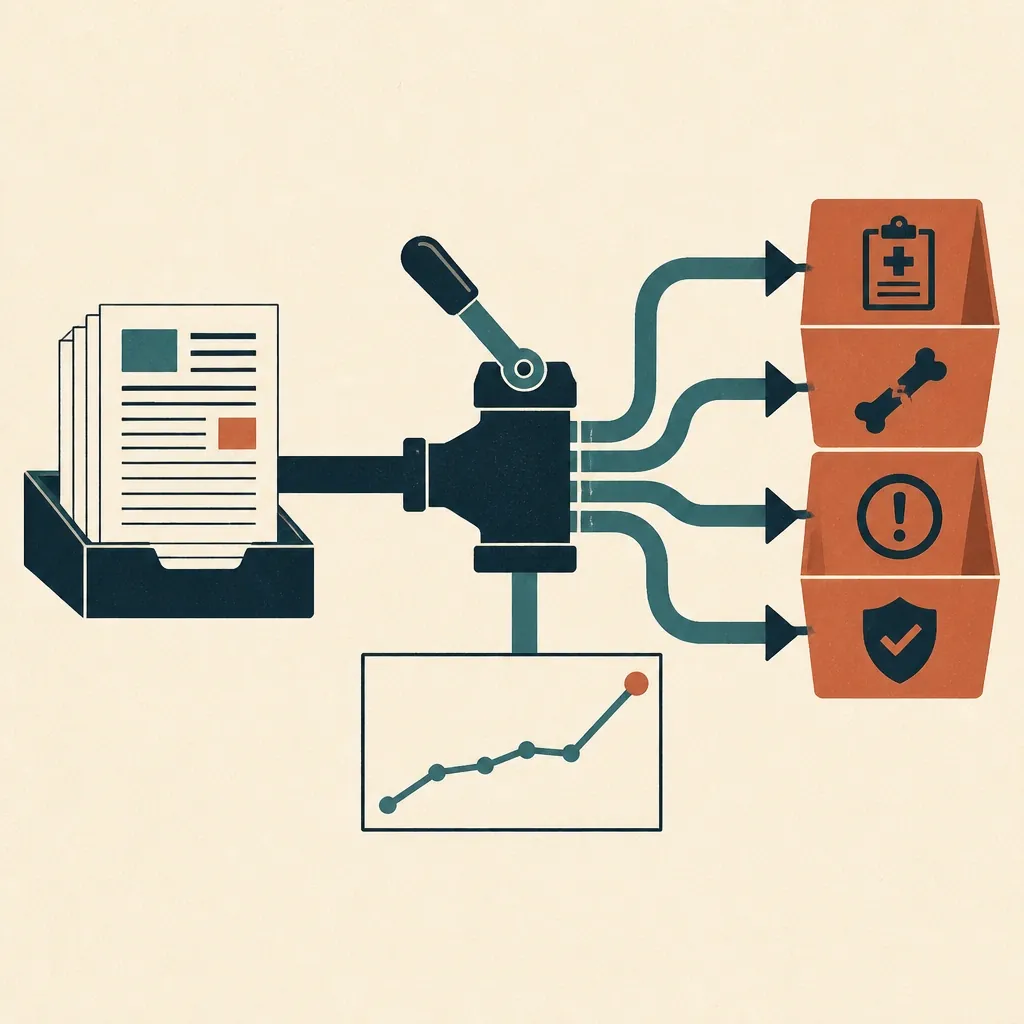
Denials split by cause rather than by payer, so a rising clinical rate is visible in the week it starts rather than at quarter end.
-
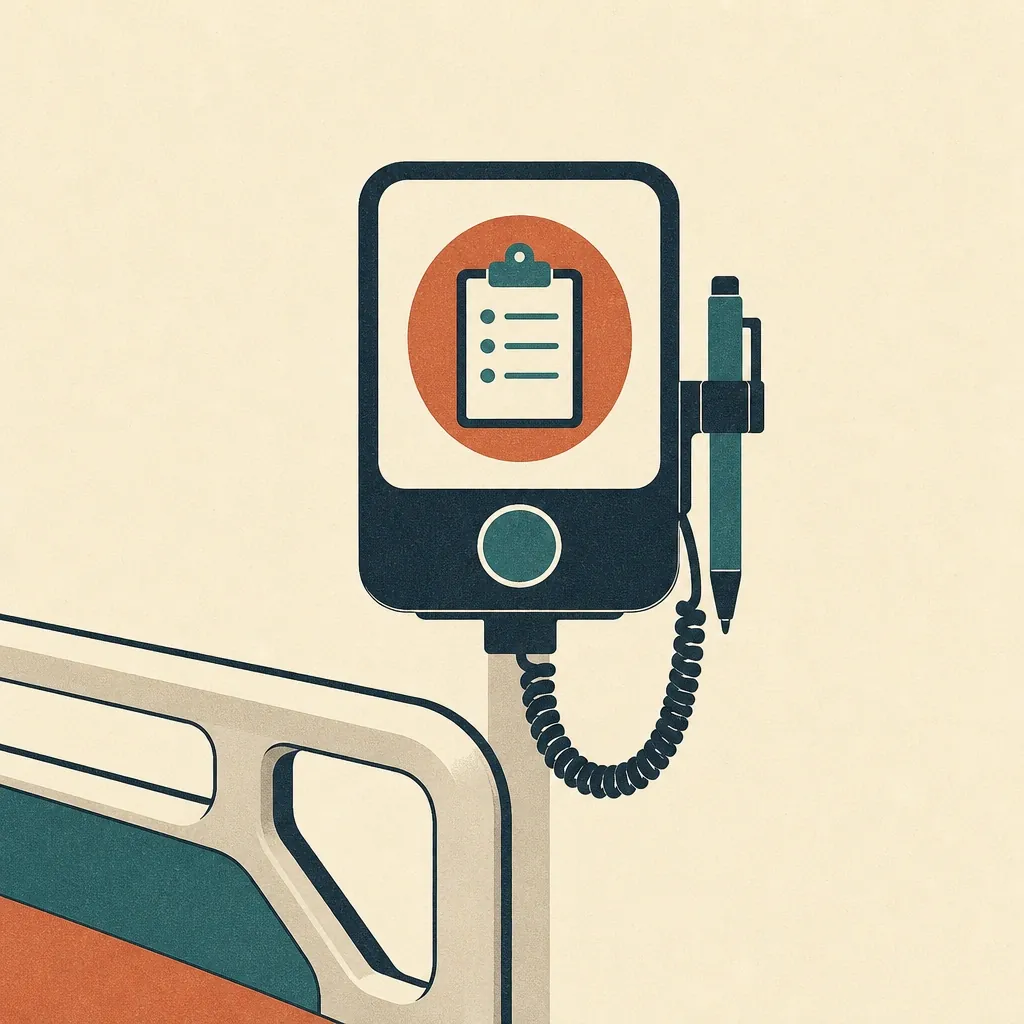
A bedside or unit prompt for the documentation that would have prevented the denial, at the moment it is still cheap to add.
How you would know it worked
Numbers in your own reporting, not ours.
- Initial denial rate split into clinical and technical, tracked weekly.
- Share of clinical denials appealed, which is the number that moves first.
- Final denial rate, which is the one that turns into written-off revenue.
Straight answers
Where a model is involved, it is scored against your own records first. Accuracy per source, not one flattering average.
The questions this raises
-

Our denial rate looks normal against the benchmark. Should we care?
Look at the split rather than the total. The published increase was almost entirely clinical, so a flat overall rate can hide clinical denials rising while technical ones fall.
-

Does this replace our revenue cycle vendor?
No. It sits beside them. They submit and track; the gap is arguing a denial that turns on clinical evidence, and that work needs the chart rather than the claim.
-

Who signs the appeal?
A person, always. The system assembles evidence and drafts a first version against the payer's stated reason. Nothing is submitted without a human approving it.
-

Can AI read the chart for this?
That is exactly where it earns its place, and we score it against appeals your team already won before anyone relies on it. Accuracy is reported per payer.
Where the figures come from
We did not make these up, and you should not take our word for them.
The evidence is already written down
Six sectors, one problem: the answer is in the notes.
A clinician wrote what happened in prose, because prose is how care is recorded. Every system downstream wants a code, a flag or a field, and none of them can read the sentence that would have answered them.
- Home healthThe most common HOPE failure is a window somebody missed
- Physician groupsThere is a monthly payment you are allowed to bill and are not
- Senior livingOne in four residents falls each year, and the warning was in the logs
- Skilled nursingNine out of ten denials are never appealed
- Skilled nursingThe condition was in the nursing note. It never reached the MDS.
Six sectors, and in every one the answer was already in the record. If yours writes anything down in prose, it is there too.Show us what your notes say.
A clinical denial is an argument about a chart, not about a field.
The build is the worklist, the evidence pack assembled from the chart, and a denial split by cause rather than by payer.
See everything we build-
 Software
 -
 Hardware
 -
 Ways of working
 -
 Whole ventures
Is this happening to you? Tell us the size of it.
Twenty minutes. We will tell you honestly whether the numbers justify doing anything about it.