


Major events now cost more outage hours than every ordinary year combined
Why is our outage duration rising when our reliability work has not changed?
Figures and rules on this page apply to
United States
Working somewhere else? The shape of the problem usually travels. The deadlines do not.
What this looks like
Blue-sky reliability looks fine and has for years. Then one event arrives and the annual figure doubles. The post-event review asks where the crews were and when the feeder was isolated. The honest answer gets assembled afterwards from three systems and a group chat, because nothing recorded it live.
The numbers
Every figure here is someone else’s. Check them.
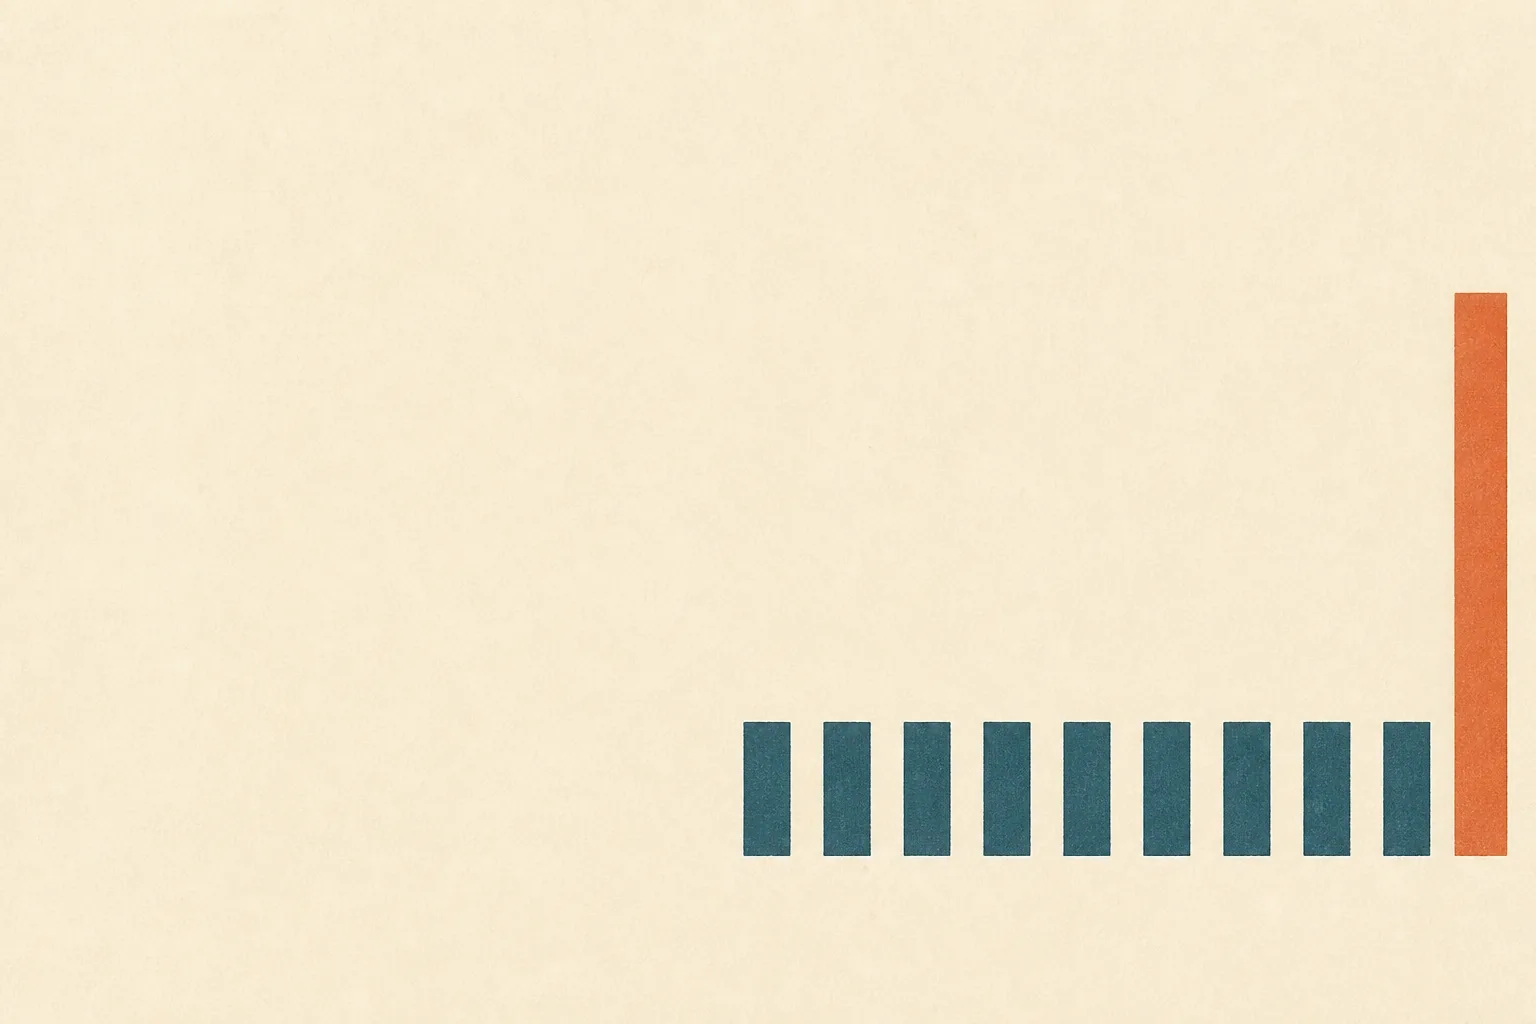
- ~9 hoursaverage interruption from major events per customer in 2024
- ~4 hoursaverage from major events per year across 2014 to 2023
- ~2 hourstypical annual interruption excluding major events, which has stayed flat
- 5.6 hourstotal average interruption per customer in 2022, with 1.4 interruptions each
Why it happens
It is not a people problem.
The ordinary number has not moved; the tail has. That changes what reliability work has to be good at. Steady-state reliability is an asset problem, and utilities are good at asset problems. Event response is an information problem: which feeders, which crews, which customers, right now, in one picture. That picture has to exist before the event, not be assembled after it.
Why your current software has not fixed it
Because it was never built to.
SCADA knows the switching. The outage system knows the calls. The historian knows the equipment, GIS knows the geography, and the crew management system knows who is where. Each is excellent and each was bought to answer its own question. No vendor sells the join, because the join is specific to which five systems you happen to own.
Intelligence, plumbed in
The earliest signal in an event is usually a field note, not a telemetry point.
The build is one event view across SCADA, outage, GIS and despatch, plus a field tool that works with no signal. Underneath it: a connector, one agreed meaning per field, and a test set scored on your own records.
How we make AI survive real data-
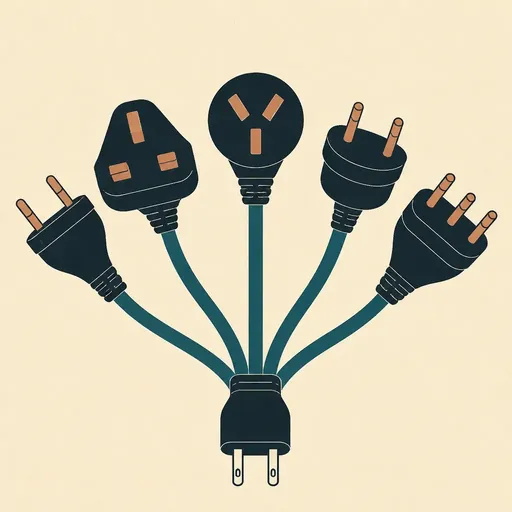 Connectors
 -
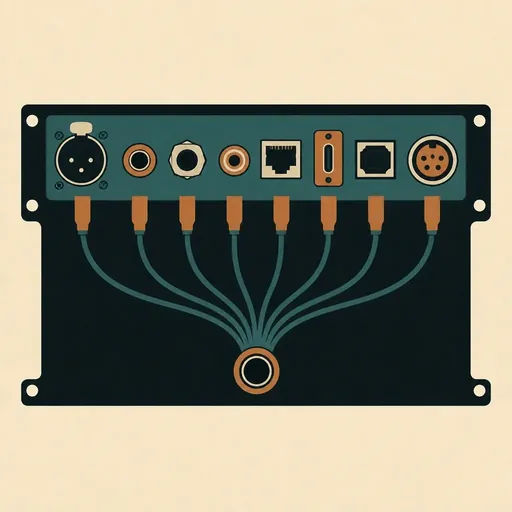 A semantic layer
 -
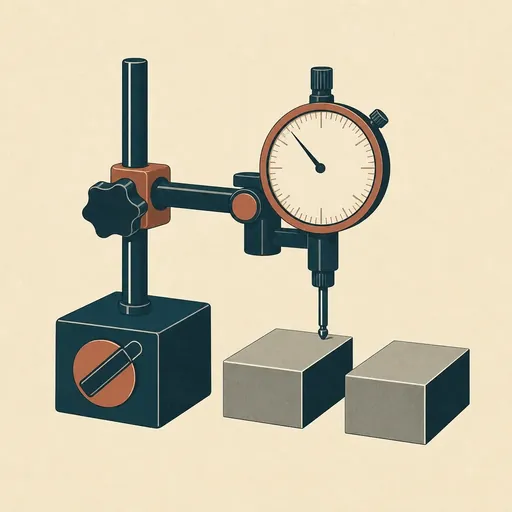 Evals you can check
However hard, whatever it is
Outage response is one example. Bring whatever costs you most.
We wrote this up because the published data makes it checkable. If yours is billing, connections or crew scheduling, the method is identical.
-
 01
01 We sit with you
Days where the work happens, not a workshop in a meeting room. We watch the job get done and write down the shortcuts nobody wrote down.
-
 02
02 We read everything
Your data, your rules, your vendors and their documentation, and the published research on your sector. We report what is actually in there.
-
 03
03 We break it to first principles
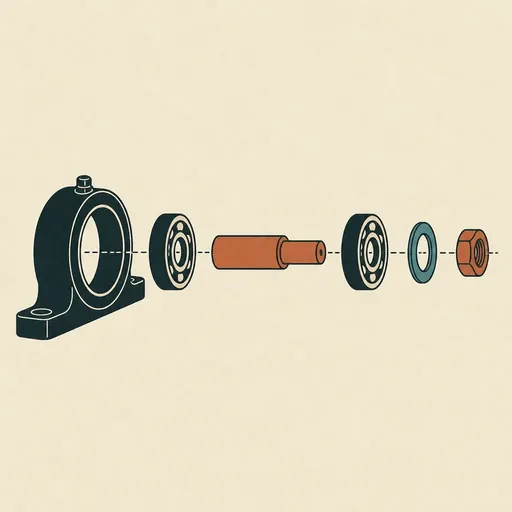
Not which tool fixes this. What is actually causing it, taken apart until we reach the piece that cannot be divided further.
-
 04
04 Then we build
Weeks, not quarters. By this point we are not guessing what to build, and guessing is the thing that makes projects long.
What we build
Specific enough to argue with.
Four mechanisms, not four features. Each one is a thing that happens on its own, every day, whether or not anyone remembers to run it.
-
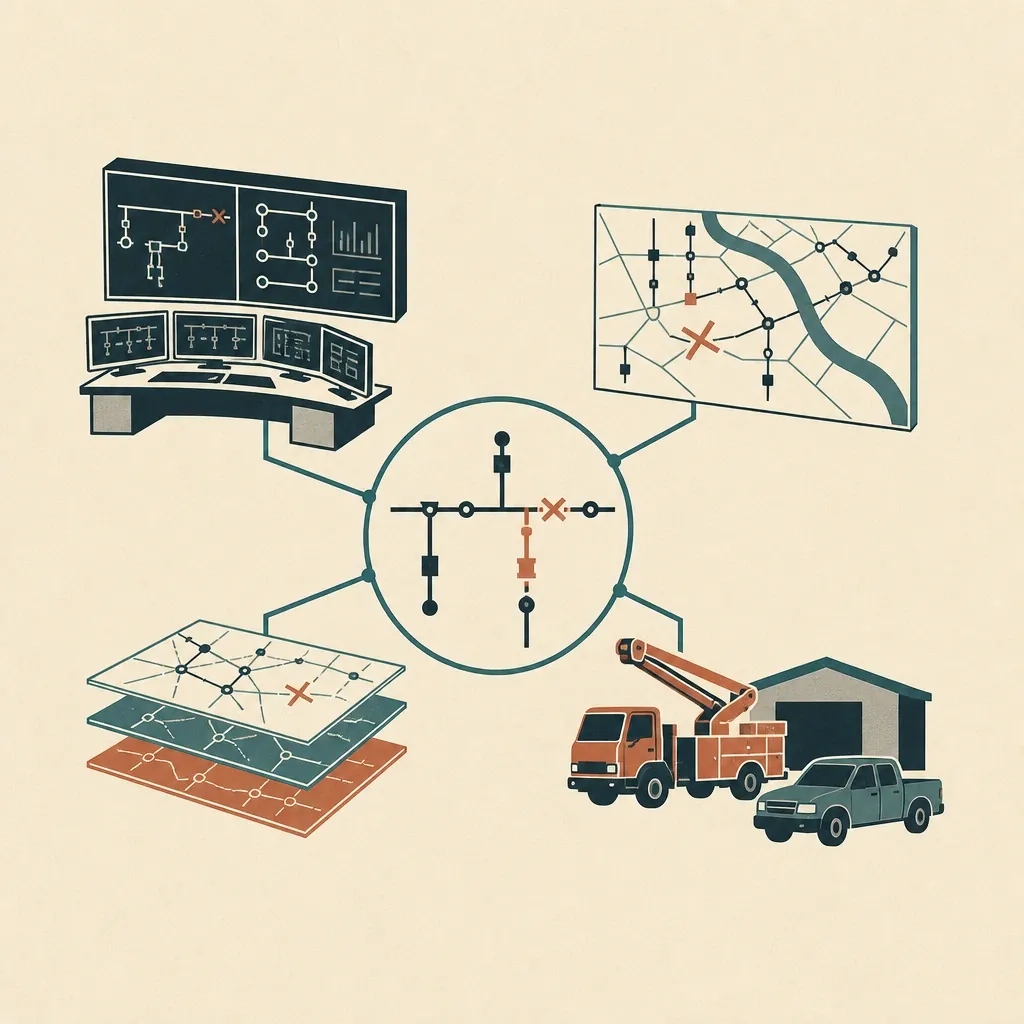
One event view across SCADA, the outage system, GIS and crew despatch, built before the event rather than reconstructed after it.
-
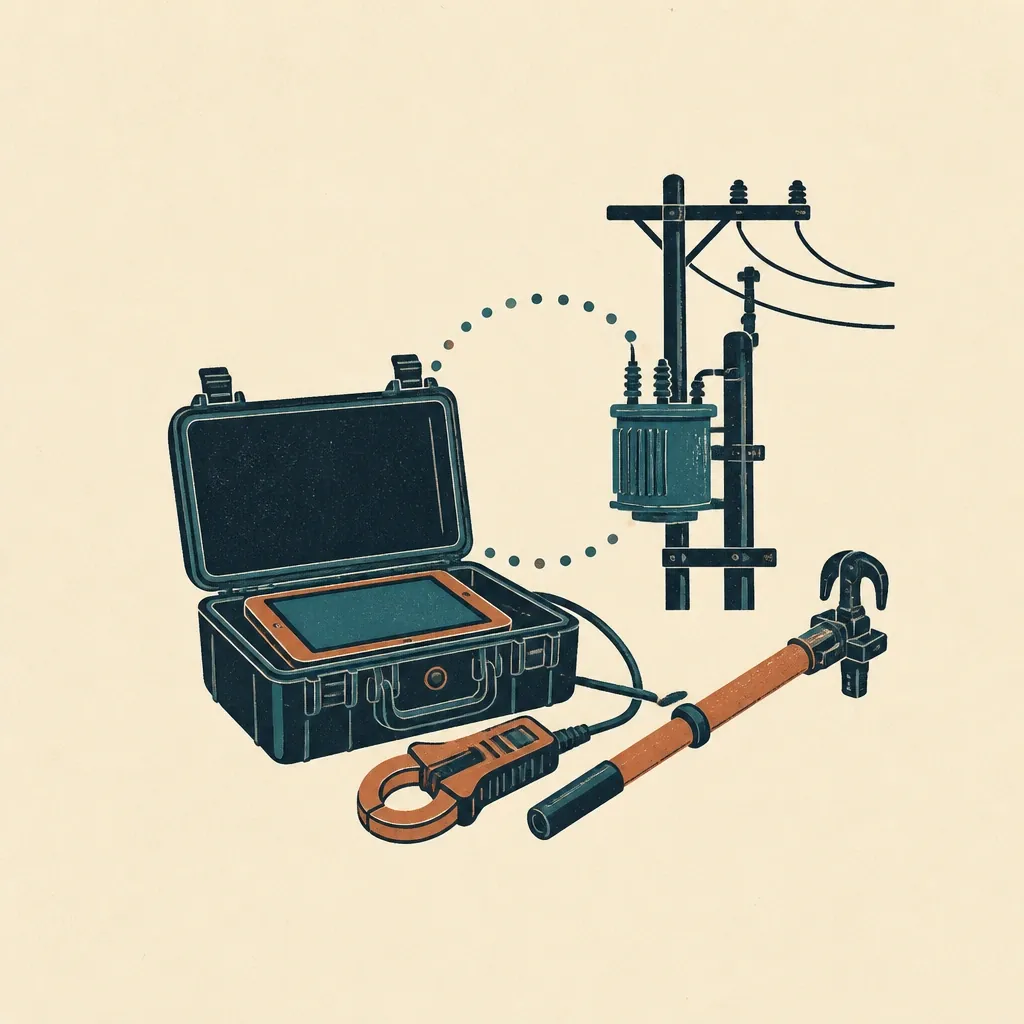
A field tool that works with no signal and reconciles when it returns, because an event is exactly when the network is worst.
-
The regulatory return assembled from what actually happened, rather than pieced together three weeks later.
-
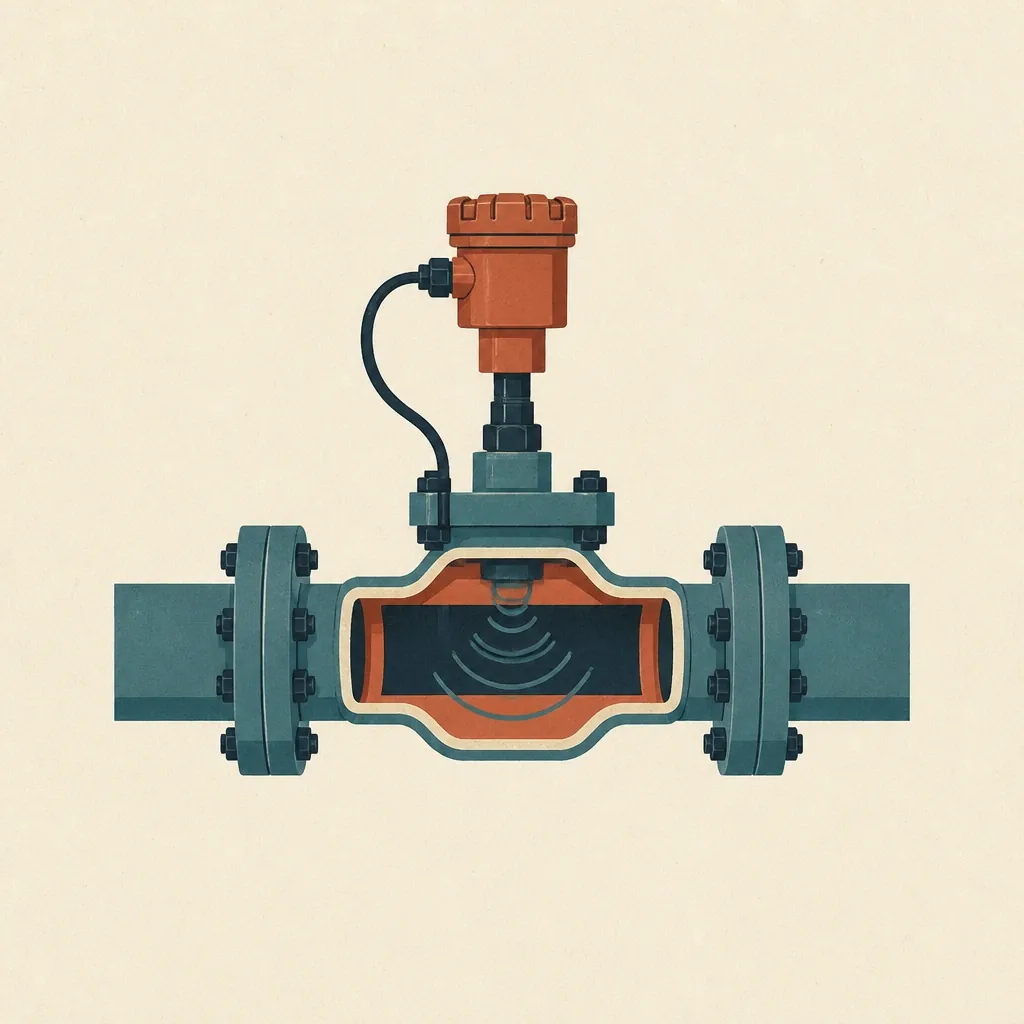
A sensor where the existing device cannot tell you what you need, built and installed by us.
How you would know it worked
Numbers in your own reporting, not ours.
- Time from first indication to a confirmed extent of outage.
- Share of restoration steps captured as they happen rather than entered afterwards.
- Hours spent assembling the regulatory return, before and after.
Straight answers
Where a model is involved, it is scored against your own records first. Accuracy per source, not one flattering average.
The questions this raises
-
Our SAIDI excluding major events is good. Is that not the right measure?
It is the right measure of steady-state reliability and it says your asset work is sound. It is not what your customers experienced in 2024, and increasingly not what the regulator asks about.
-
Do you write into SCADA?
No. We read it. Nothing we build sends a command to a device, and we would be suspicious of anyone who offered to.
-
We are mid-way through an ADMS programme.
Then this usually helps it. A working picture of what your data actually contains is the most useful input to that programme and the thing most of them discover late.
-
Can this run with no connectivity in the field?
It has to. The tooling works offline and reconciles on return, because the moment you need it most is the moment the network is worst.
Where the figures come from
We did not make these up, and you should not take our word for them.
Somebody noticed first, and nothing consumed it
The earliest warning is a note in a box nothing reads.
A driver, a fitter, an engineer or an adviser saw it coming and wrote it down. It went into free text. Free text does not trigger anything, does not add up, and never tells you that four people reported the same thing this week.
- ConstructionBuilding productivity rose. Highways and bridges went backwards
- EducationEnrolment is up this year. The intake pool peaked last year
- ManufacturingProductivity fell in fourteen of the twenty manufacturing groups measured
- StaffingFive million people hired and five million separated in the same month
- Transport & fleetMore than a third of crashed trucks already had out-of-service defects
Different work, same box nobody reads. Whatever your people notice first, it is being written down somewhere already.Tell us what yours write down.
Steady-state reliability is an asset problem. An event is an information problem.
The build is one event view across SCADA, outage, GIS and despatch, plus a field tool that works with no signal.
See everything we build-
 Software
 -
 Hardware
 -
 Ways of working
 -
 Whole ventures
Is this happening to you? Tell us the size of it.
Twenty minutes. We will tell you honestly whether the numbers justify doing anything about it.