


Fifty-five cents of every revenue dollar goes to running the bank
Where is our efficiency ratio actually going, and why can we not see it?
Figures and rules on this page apply to
United States
Working somewhere else? The shape of the problem usually travels. The deadlines do not.
What this looks like
The efficiency ratio is reported quarterly and discussed seriously. Nobody in the room can name the three tasks that move it. They are not hiding. One person matches a statement to the core, a second checks the first, and a third assembles the pack proving both happened. None of those has a system, so none of them has a number.

The numbers
Every figure here is someone else’s. Check them.
- 166.8%reserve coverage ratio, which fell as noncurrent loans rose faster than allowances
Why it happens
It is not a people problem.
Operating cost concentrates in work that sits between systems. A reconciliation break is not owned by the core, the payments rail or the ledger, because it exists precisely where they disagree. Work with no owning system gets done by a person. Work done by a person is the last thing anybody measures, because measuring it means watching.
Why your current software has not fixed it
Because it was never built to.
Your core banking platform is correct about what it holds and was never meant to be the place where an external statement is argued with. Reconciliation products exist and are good at matching what matches; the residual, which is the expensive part, is the set of cases that need judgement. That residual is specific to your products and the firms you trade with, so nobody ships it.
Intelligence, plumbed in
A loan file is forty documents. Turning it into fields is reading, not matching.
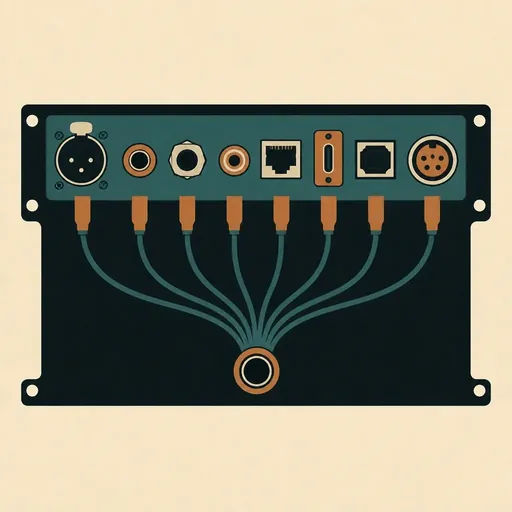
The build is a break sheet that names the cause, a file that assembles itself, and maker-checker preserved exactly as written. Underneath it: a connector, one agreed meaning per field, and a test set scored on your own records.
How we make AI survive real data-
 Connectors
 -
 A semantic layer
 -
 Evals you can check
However hard, whatever it is
Reconciliation is one example. Bring the one keeping you up.
We wrote this up because the published ratio makes the outcome checkable. If yours is onboarding, collections or a regulatory return, the method is the same.
-
 01
01 We sit with you
Days where the work happens, not a workshop in a meeting room. We watch the job get done and write down the shortcuts nobody wrote down.
-
 02
02 We read everything
Your data, your rules, your vendors and their documentation, and the published research on your sector. We report what is actually in there.
-
 03
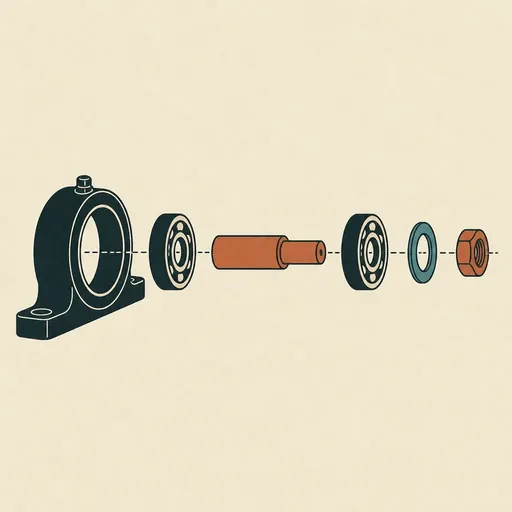
03 We break it to first principles
Not which tool fixes this. What is actually causing it, taken apart until we reach the piece that cannot be divided further.
-
 04
04 Then we build
Weeks, not quarters. By this point we are not guessing what to build, and guessing is the thing that makes projects long.
What we build
Specific enough to argue with.
Four mechanisms, not four features. Each one is a thing that happens on its own, every day, whether or not anyone remembers to run it.
-

A break sheet that names the probable cause rather than only the amount, so the first ten minutes of every investigation stop being rediscovery.
-

The loan or case file assembled from what you already hold, so the pack that proves the control is generated rather than collected.
-
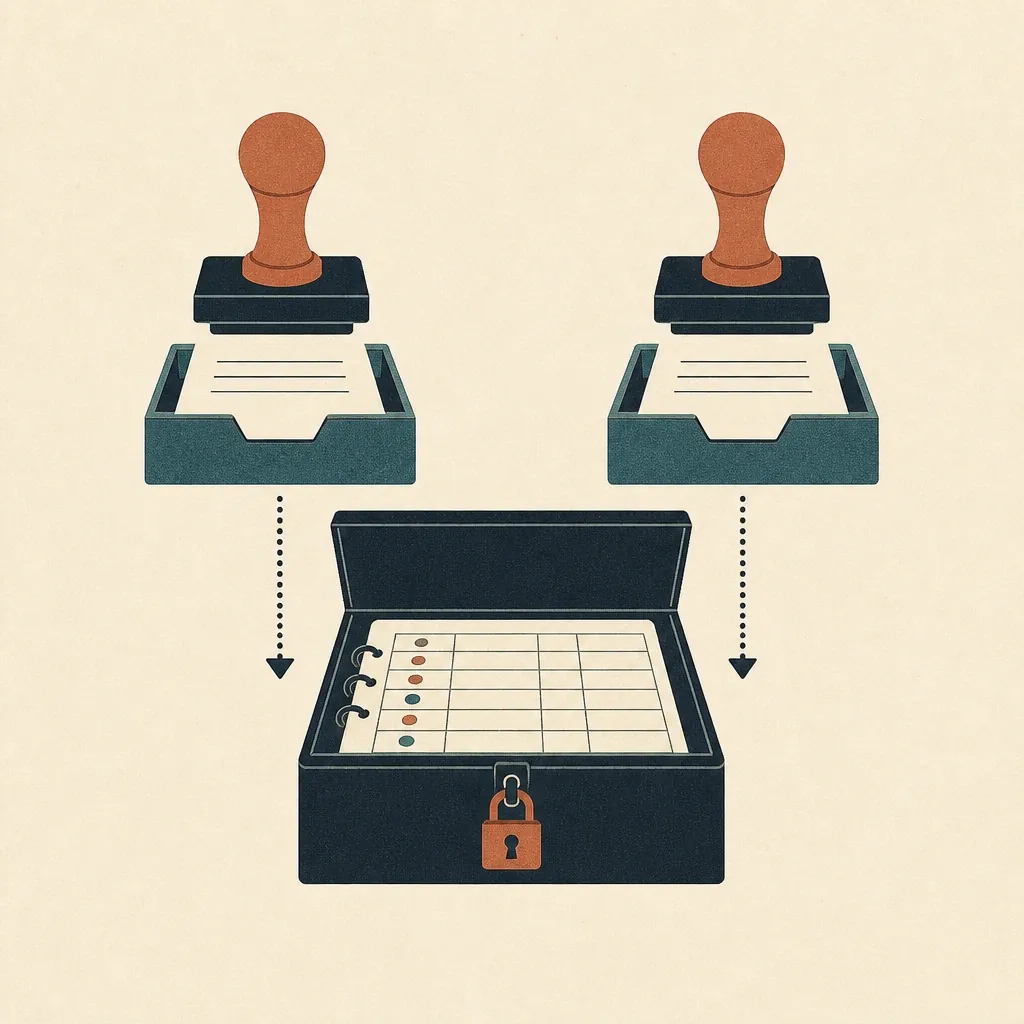
Maker and checker preserved exactly as your policy requires, with nothing posted automatically and every action logged.
-

A branch or field tablet that keeps working when the line drops, because the fallback today is paper and paper becomes a reconciliation next week.
How you would know it worked
Numbers in your own reporting, not ours.
- Efficiency ratio, which is the published outcome, tracked against the operational numbers below it.
- Average time to clear a break, split by cause rather than by amount.
- Share of breaks cleared without a person opening a second system.
Straight answers
Where a model is involved, it is scored against your own records first. Accuracy per source, not one flattering average.
The questions this raises
-

We already have a reconciliation tool. What is left?
The residual. Matching tools clear what matches. The cost sits in the cases that need judgement, and those are specific to your products and the firms you trade with.
-

Does anything post automatically?
No. Reads are automatic; postings wait for a maker and a checker exactly as your policy says. We would not build it differently and you should not accept it.
-

Our core is old and the vendor quotes heavily for integration.
A nightly fixed-width file, a green screen or a printed report are all workable routes. Ask the vendor to put the impossibility in writing; the answer is usually informative.
-

How would we know it worked?
The efficiency ratio is already published quarterly, so the outcome measure exists. We agree the operational numbers underneath it before anything is built.
Where the figures come from
We did not make these up, and you should not take our word for them.
Every partner sends a different shape
The format belongs to them. The cost lands on you.
Documents arrive from outside in whatever shape the sender chose, and the sender changes it whenever their own system does. No vendor can ship this. The set of formats is specific to who you trade with, which is why it ends up as a script nobody owns.
- Agriculture & foodThe traceability deadline moved to 2028, and nothing else changed
- HospitalityThe roster was set last Tuesday. The covers were not
- InsuranceA combined ratio above one hundred means underwriting lost money
- RetailShrink went from 1.4 to 1.6 percent, and the till already knew where
- Supply chainThe official inventory number arrives six weeks after the month it describes
Bordereaux, carrier files, supplier invoices, delivery notes. Whatever arrives in your inbox in nine shapes is the same job.Send us the messiest one you have.
The cost sits in work that no system owns, which is why nothing measures it.
The build is a break sheet that names the cause, a file that assembles itself, and maker-checker preserved exactly as written.
See everything we build-
 Software
 -
 Hardware
 -
 Ways of working
 -
 Whole ventures
Is this happening to you? Tell us the size of it.
Twenty minutes. We will tell you honestly whether the numbers justify doing anything about it.